Analysing Application Performance
The process of optimising graphics applications
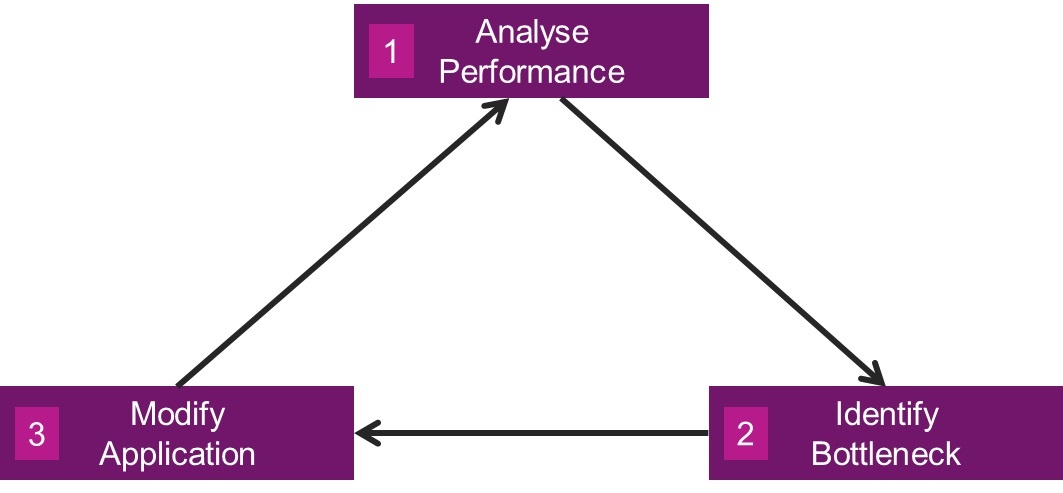
The diagram below shows the steps for optimising graphics applications. Although the steps may seem straightforward, both beginners and experienced developers in the past have made simple mistakes that ended up costing large amounts of development time to resolve. Developers tend to run their analysis tools, identify a bottleneck, modify their application, and then consider the work done. However, one of the most important stages of optimisation is to verify the change has actually improved performance. Without analysing performance after a modification, it is easy for new, or possibly worse, bottlenecks to creep their way into a renderer.

The right tools for the job
The PowerVR SDK includes profilers, debuggers, and a variety of other analysis tools to help developers track down issues. Here’s a quick overview of the key utilities:
PVRTune is a graphics performance profiling tool which can remotely monitor and analyse an application’s hardware performance on the development machine. PVRTune captures timing data, counters, and other core driver information in real-time.
PVRShaderEditor is an offline shader editor and performance analysis tool. It is able to compile and produce disassembly in real-time while also providing performance estimates for PowerVR graphics cores.
PVRCarbon is an API capture and debugging tool. It is able to capture, record, and playback API calls for OpenGL ES and Vulkan, while also providing insight into buffer information and analysis and debugging of API usage.
For more information regarding our development tools, visit our developer portal.

