PVRCarbon Frame Analysis GUI
PVRCarbon features a Frame Analysis GUI for in-depth analysis of individual frames.
Analysis files can be generated from PVRCarbon recordings by either using PVRCarbonFrameAnalysis command line utility or by clicking the Frame Analysis button in the GUI.
PVRCarbon analysis files (.pvrcbna) are completely independent from their original PVRCarbon recordings (.pvrcbn).
Overview
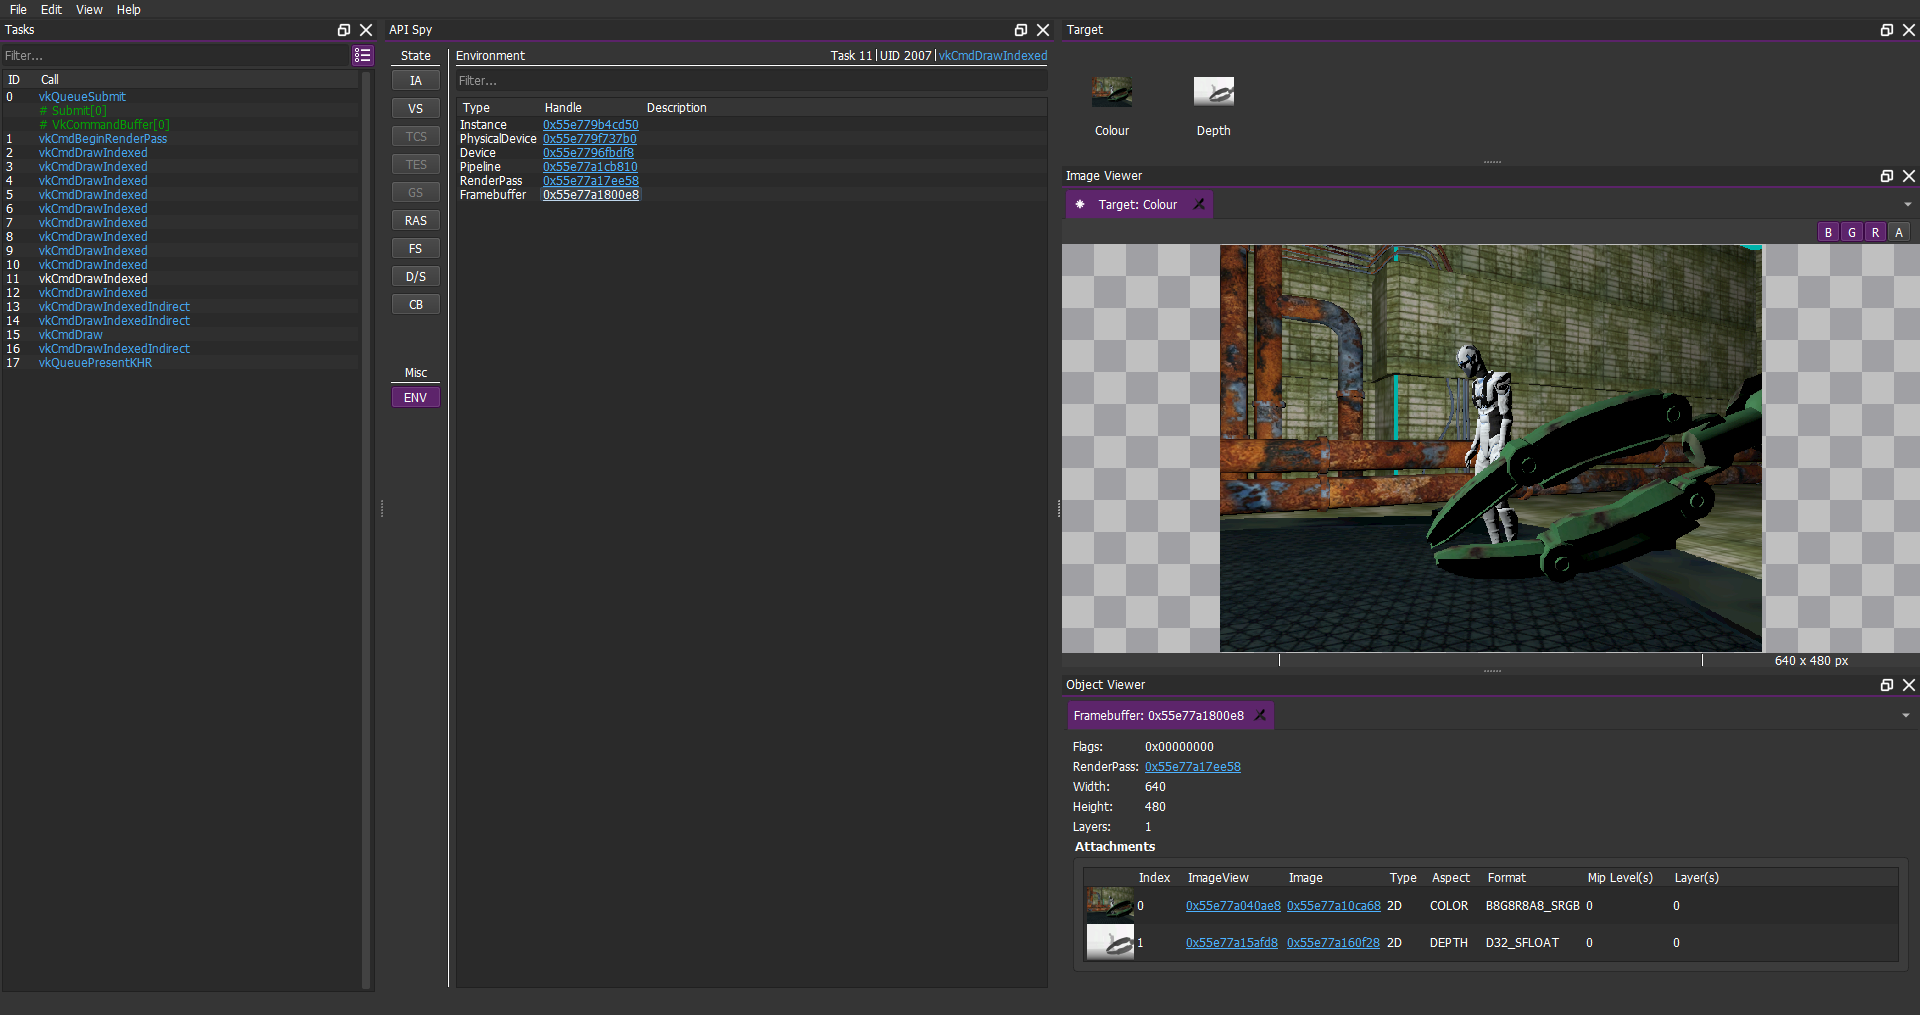
The Frame Analysis GUI consists of four main components:
Tasks window
API Spy
Image and Object Viewer
Target Viewer
These components allow for a low-level inspection of API usage and GPU work in a simple and intuitive way.
Tasks Window
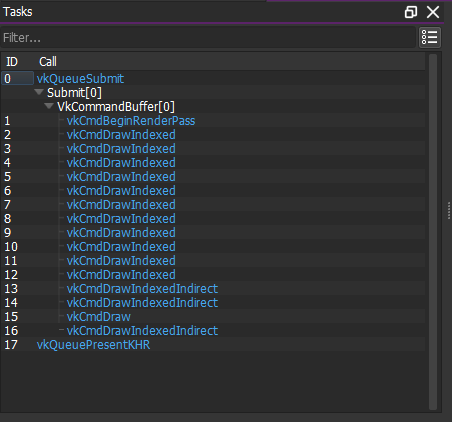
The Tasks window in the Frame Analysis GUI is similar to the Function Call List in that it contains the API calls that have contributed to rendering the selected frame.
The Tasks window displays the sequence of API calls in the render loop as a hierarchical tree view. For Vulkan applications, this means the tree view illustrates how queues, command buffers, and draw calls are organised within each other. This makes it easier to conceptualise exactly how the frame is rendered.
Each call has a call number adjacent to it which refers to the ID number in the Function Call List of the original recording.
Selecting an API call opens information about this call in the API Spy and the Current Call tabs.
API Spy
The API Spy is one of the most important parts of the Frame Analysis GUI, as it allows all of the associated state and context of an API draw call to be analysed.
The information below gives a brief overview of the various sections in the API Spy.
Miscellaneous - Environment
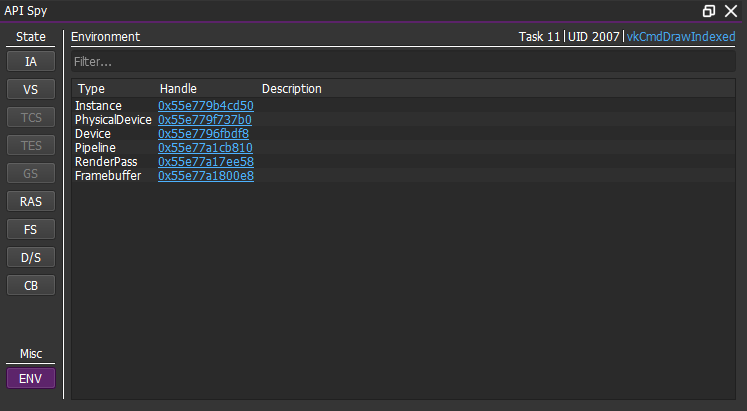
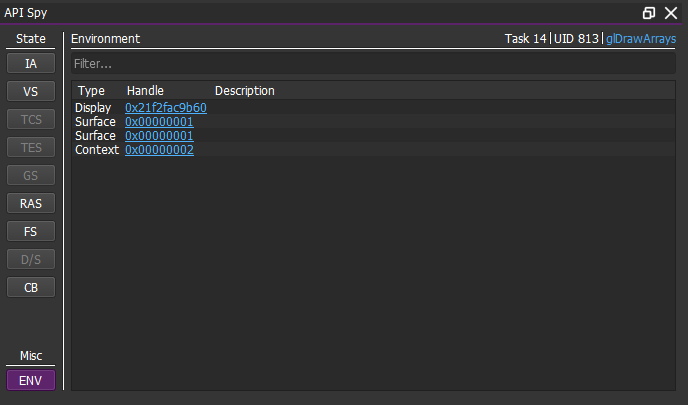
The Environment section of the API Spy shows the API infrastructure required to render a frame. This includes objects such as an Instance, a Physical Device, and Renderpasses in Vulkan, and includes Contexts, Surfaces, and Displays in OpenGL ES.
These objects can be opened in the Object Viewer to be examined in more detail.
Below are examples captured from a Vulkan application and an OpenGL ES application, respectively.
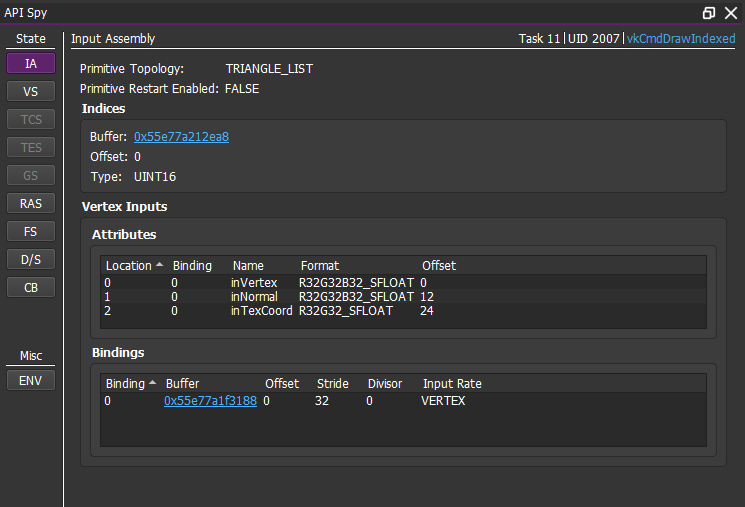
Pipeline State: Input Assembly
The Input Assembly is an element of the pipeline state which describes how the rendering pipeline should assemble incoming vertex data into primitives. This includes the topology of outgoing primitivies.
PVRCarbon adds another element of the pipeline state to this section of the API Spy - the Vertex Input. The Vertex Input defines what the vertex data looks like and the vertex buffer it will come from.
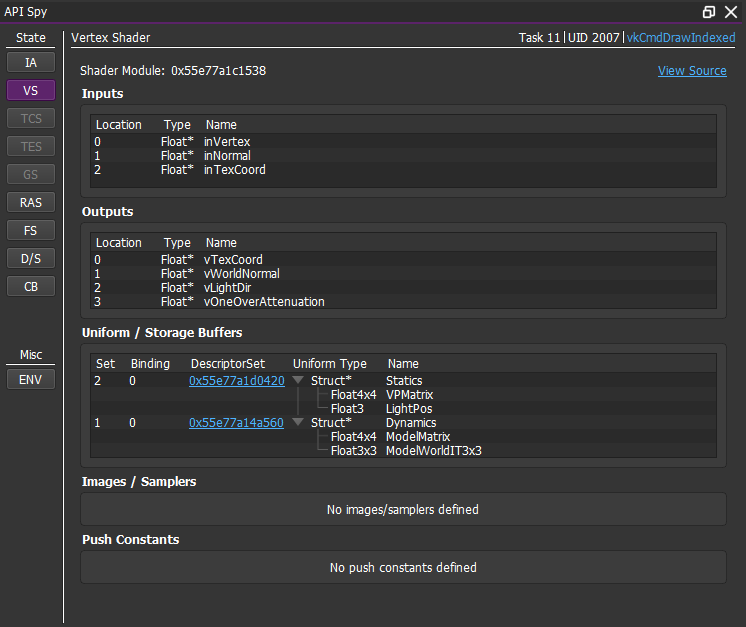
Pipeline State: Vertex Shader
The Vertex Shader section shows the information defined for the vertex shader stage of the pipeline. This includes:
A reference to the shader module object which surrounds the shader source code;
Any shader input and output variables with their name and type;
Any allocated storage buffers with the associated descriptor set;
Any push constants or images.
Note
You can view the vertex shader source code in the Object Viewer by selecting “View Source”.
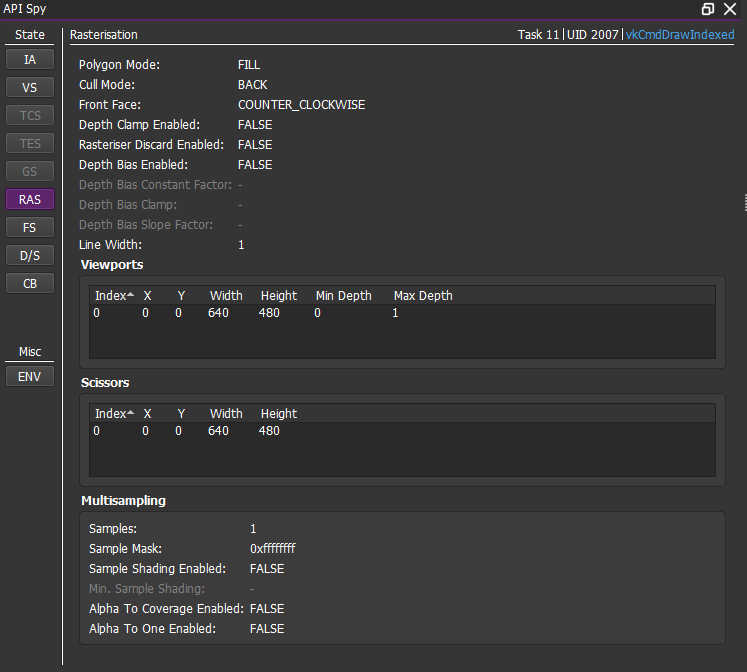
Pipeline State: Rasterization
Rasterisation pipeline stage converts the primitives from the Input Assembly into fragments. The API Spy displays all of the information set in VkPipelineRasterizationCreateInfo struct, including the polygon fill mode, culling mode, front face winding order, rasterized line width, and depth bias.
This section of the API Spy also contains the defined viewports and scissors, and any multisampling settings.
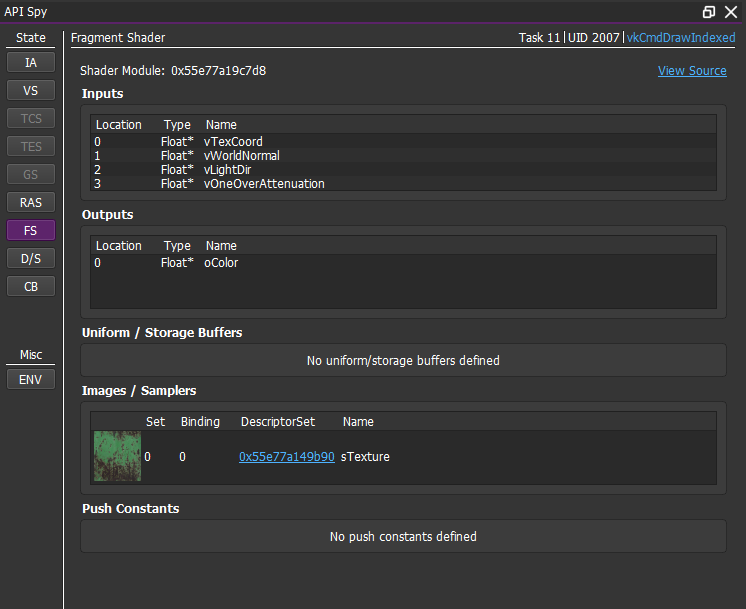
Pipeline State: Fragment Shader
Similarly to the vertex shader stage, this defines the fragment shader used by the pipeline.
The API Spy again shows the shader inputs and output, storage buffers, push constants, and images utilised by the fragment shader.
Note
You can view the fragment shader source code in the Object Viewer by selecting “View Source”.
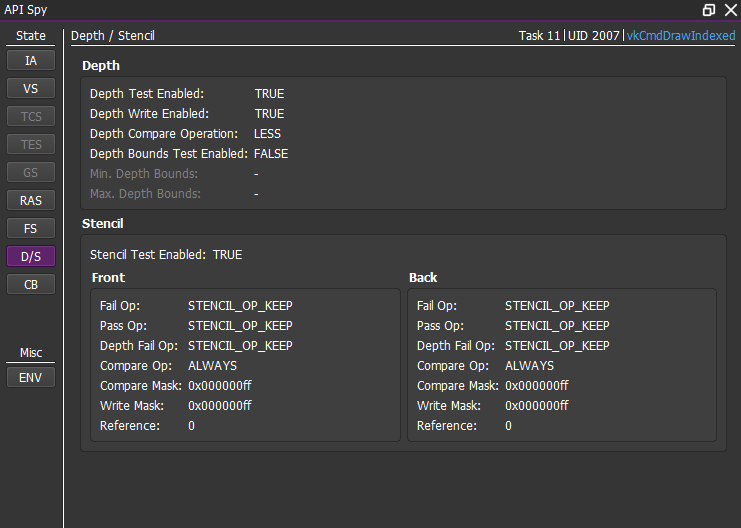
Pipeline State: Depth Stencil
The Depth Stencil section contains the configuration of depth and stencil tests for the pipeline. The information shown in the API Spy reflects the VkPipelineDepthStencilStateCreateInfo struct.
This includes:
Whether depth and stencil testing is enabled;
The comparison operation used in depth and stencil testing;
Whether to enable depth bounds testing;
The subsequent operations after passing or failing a depth and stencil test.
Note
In the API Spy, the stencil testing configuration is divided into Front and Back sub-sections based on the settings for front-facing and back-facing fragments.
Pipeline State: Colour Blending
The Colour Blending section shows the colour blending settings per framebuffer attachment. This controls how the colours of fragments rendered into the same pixel location in the framebuffer should be mixed.
The settings shown in this section include:
Whether blending is enabled for each attachment;
Whether logical operations for blending are used;
Source and destination colour blend factors;
Source and destination alpha blend factors;
Colour and alpha blend operations.
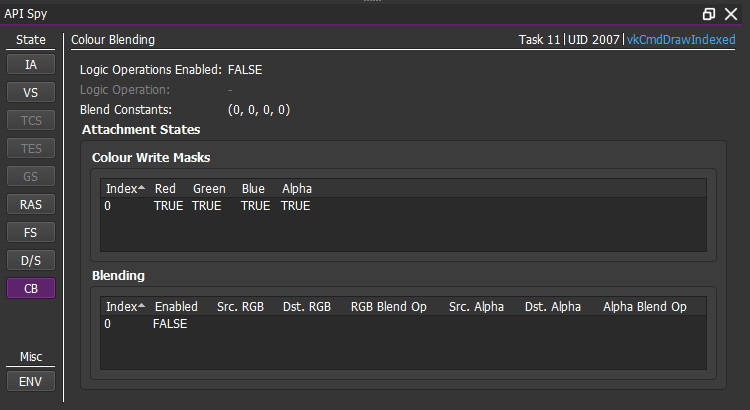
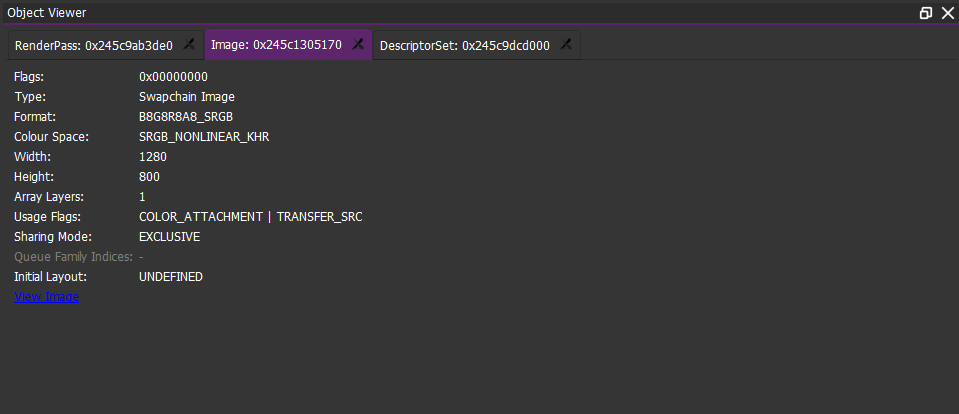
Image and Object Viewer
The Object Viewer is used to display information about a variety of API objects. It is useful for examining API objects in detail.
The information displayed in the Object Viewer varies depending on the type of object, but generally it shows the configuration set during object initialisation. The different types of objects examinable in the Object Viewer include:
Textures
Descriptor Sets
Buffers
Instances
Physical Devices
Logical Devices
Render Passes
Framebuffers
Contexts
Surfaces
Displays
Shader Programs
The Image Viewer can display the images found within framebuffer objects, as well as the contents of textures, images, and EGL surfaces. It can be used to identify any rendering artifacts or inspect an image in detail.
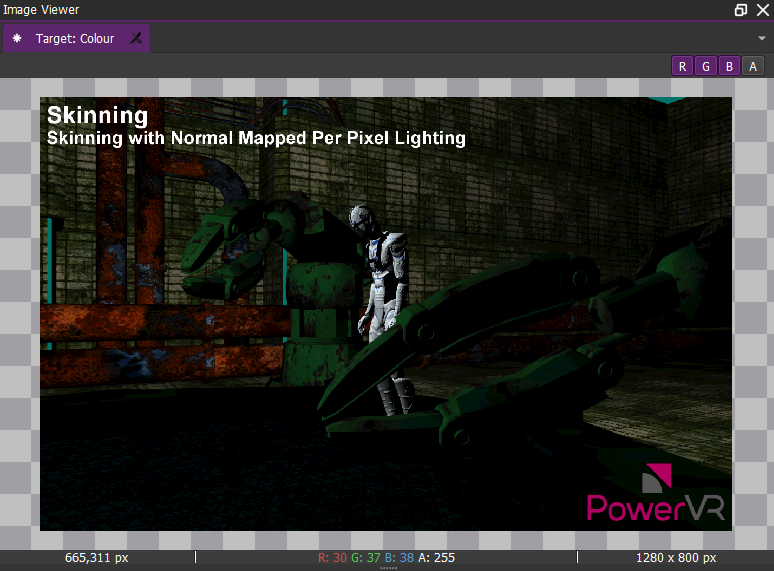
Hovering over a pixel in an image in the Image Viewer gives the location and pixel value in the bottom of the GUI.
Vulkan - Instance
This section contains all of the state associated with a VkInstance object.
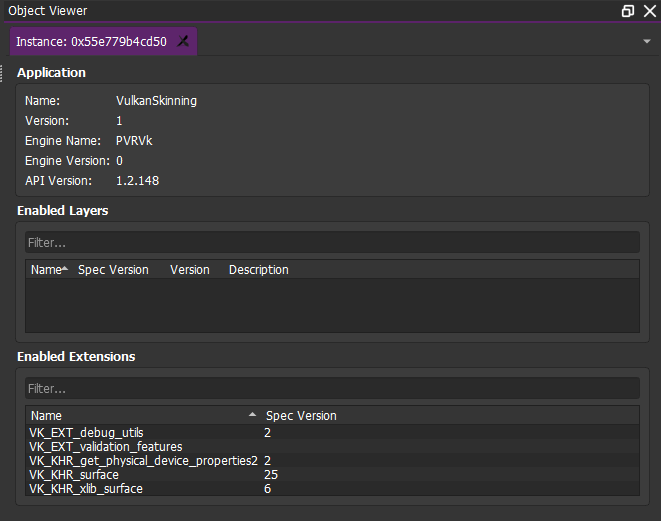
This includes:
Information about the application, including:
Name
Version
Engine
Engine Version
API version;
A list of enabled layers and their descriptions;
A list of enabled extensions
The lists in this section can be filtered using the text box above the list.
Vulkan - Physical Device
This section details information about the physical device which is used by the draw call to render the frame. A physical device is representation of the system hardware used for rendering by the application. The properties and capabilities are stored in a VkPhysicalDevice object. These are fixed and are dependent on the actual hardware and drivers.
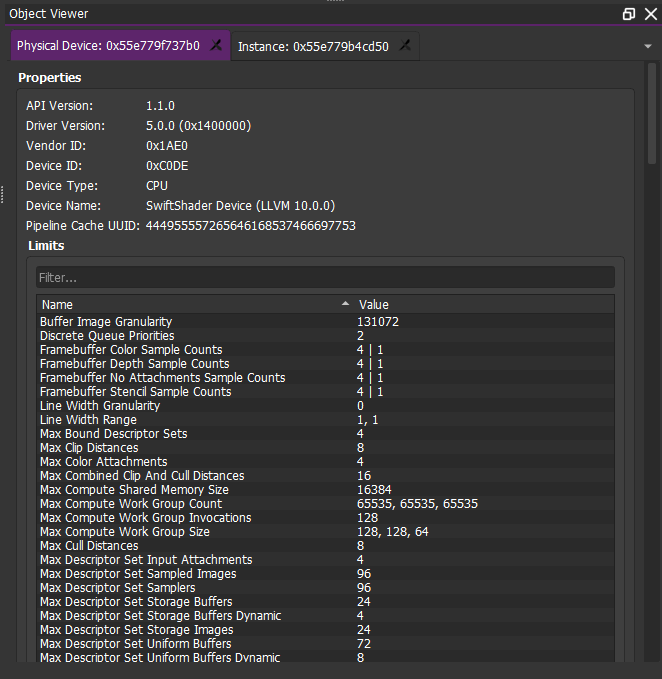
The physical device information listed by PVRCarbon includes:
Basic physical device properties, such as:
API version
Driver version
Device Type;
A list of physical device limits, such as:
Maximum image dimensions
Maximum available pool size of push constant memory
Maximum number of vertex input attributes;
A list of sparse memory properties;
A list of queue families supported by the physical device;
The various features supported by the physical device;
The extensions supported by the physical device.
Vulkan - Device
A VkDevice is the main interface between the application and the physical device. This object is created and configured during the initialisation of a Vulkan application. Devices are used to create and manage various application objects including queues, memory resources, command buffers, and pipelines.
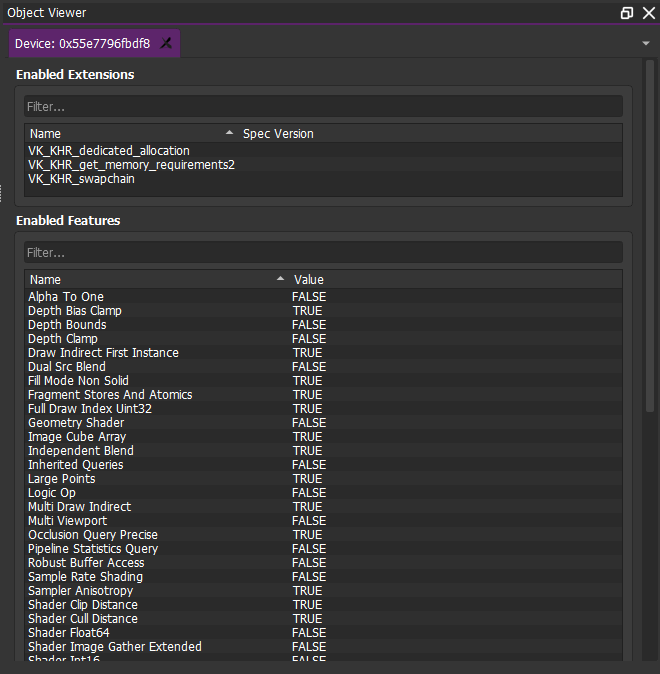
PVRCarbon lists the enabled extensions and physical device features of the device associated with the selected draw call. These extensions and features were enabled or disabled during the creation of this device.
Vulkan - Pipeline
The Pipeline section collects information from a VkPipeline object, including the type of pipeline, any set flags, the associated pipeline layout and renderpass, and any dynamic state.
Vulkan - Render Pass
In Vulkan, a render pass is used to control how rendering is performed. It contains three different types of information:
Descriptions of the framebuffer attachments
Descriptions of subpasses
Subpass dependencies.
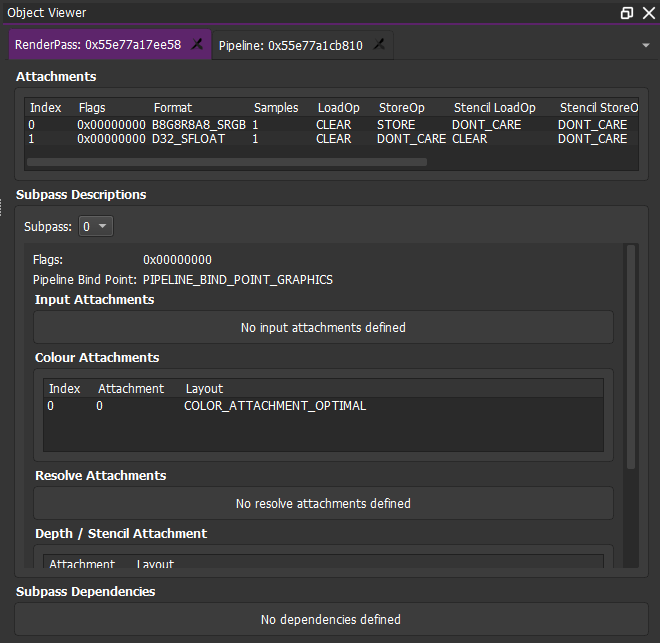
Framebuffer attachments are the resources used during rendering. These can include the final render targets, such as colour and depth buffers, or intermediate buffers called input attachments targets. The render pass does not reference the actual images that are going to be rendered to, but instead describes all of its properties and characteristics.
Subpasses represent phases of rendering during a render pass where some of the associated are read from or written into. Rendering work is recorded into these subpasses and executed at the appropriate point later.
Subpass dependencies describe the relationship between pairs of subpasses. They ensure that attachments are read from and written to in the correct order.
In Vulkan, when a draw call is executed there will be a render pass associated with the current graphics pipeline. PVRCarbon captures the information of this render pass outlined above.
Vulkan - Framebuffer
Framebuffer objects contain the attachments described in the render pass.
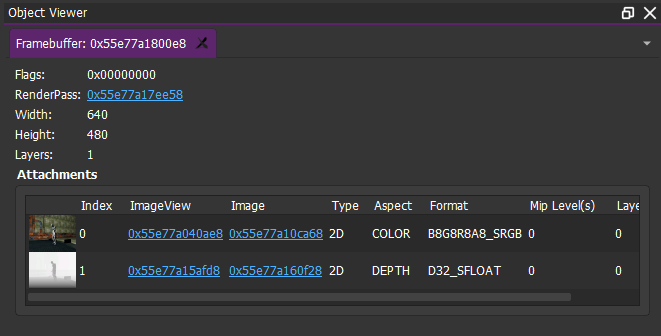
The API Spy shows a list of attachments associated with the currently selected framebuffer. The properties of each attachment are displayed in the list, including:
The Image and ImageView - these can be opened in the Image Viewer and the Object Viewer;
The image format;
The ImageView type;
Any mipmaps or layers.
A small preview of each attachment image is also included.
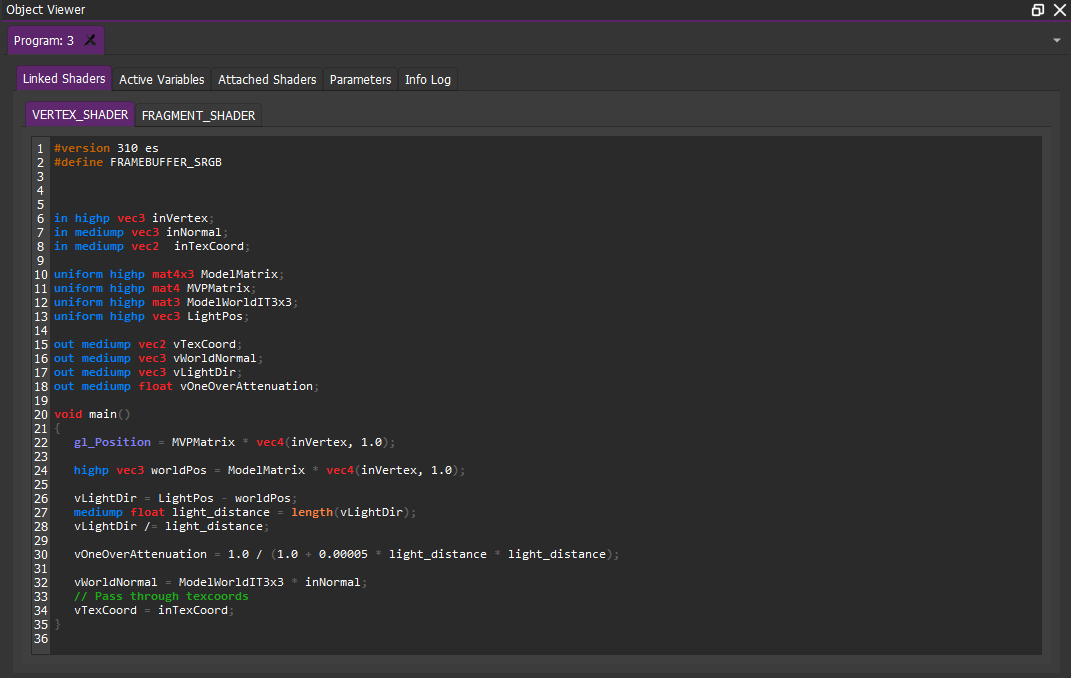
OpenGL ES - Shader Programs
Opening an OpenGL ES shader program in the Object Viewer shows the source code of the shaders linked to the program. A list of the active variables, including attributes, uniforms, buffers, and images, and set parameters.
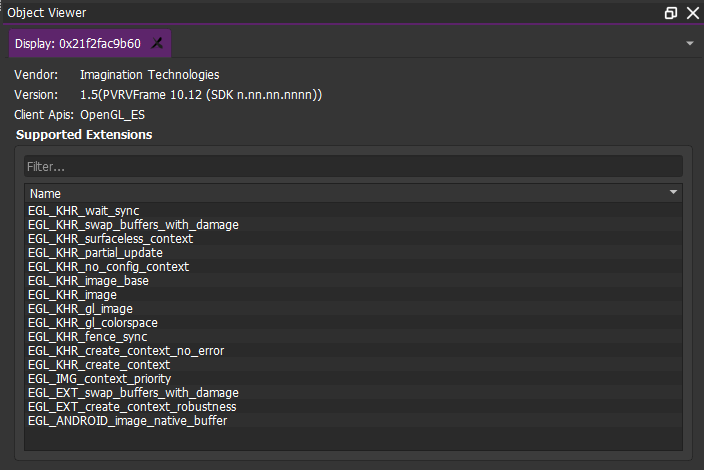
OpenGL ES - Display
A Display is an abstract object which will show the rendered graphical output. In most environments it corresponds to a single physical screen.
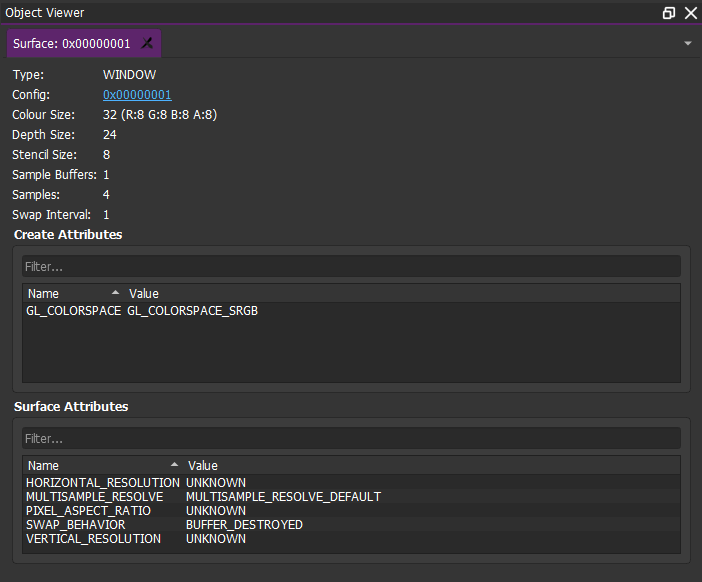
OpenGL ES - Surface
OpenGL ES calls are rendered to Surface objects.
The Object Viewer gives details about the current surface, including:
The Surface type;
The different sizes of the render targets;
The Surface attributes.
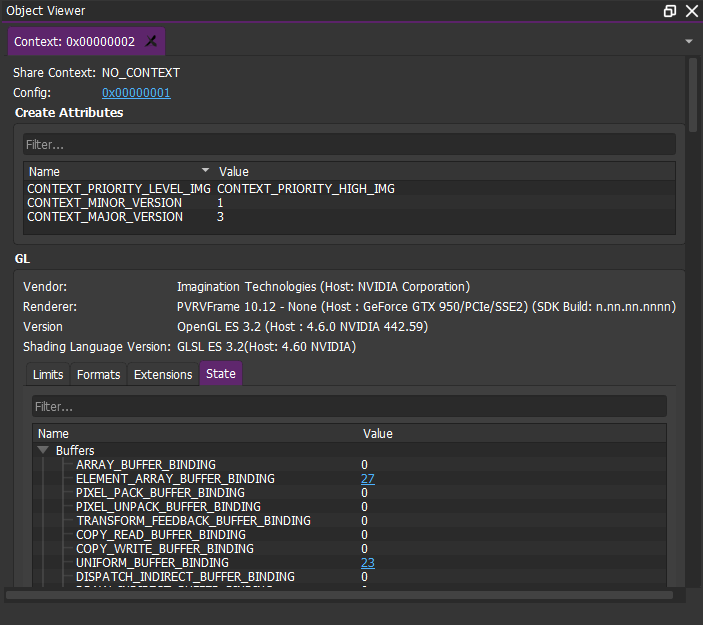
OpenGL ES - Context
The concept of a context is OpenGL ES’s way of encapsulating any resources and state. What appear to be “global” functions in OpenGL ES actually only operate on the current context. A context is required for any operation in OpenGL ES.
Target Window
The Target window shows the individual render targets which make up a frame. Render targets are intermediate buffers which are used to store information. This information is combined to create the final rendered framebuffer.
The Target window provides small previews of the render targets. Selecting these previews will open a larger version in the Image Viewer.
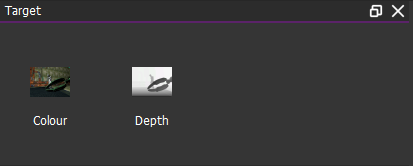
The render targets available for preview in the Target Viewer include:
Colour buffer(s)
Depth buffer
Stencil buffer.
The targets in the Target window will be updated based on the draw call selected in the Tasks list.
The Target window can help to narrow down the source of an issue in the final rendered frame.