Menu Bar in PVRTune#
This section covers details about the options available from the menu bar in PVRTune.

More details about each menu option can be found in the following sections.
File Menu in PVRTune#
The File menu provides options for opening and saving files, managing tabs, and exiting the PVRTune GUI.
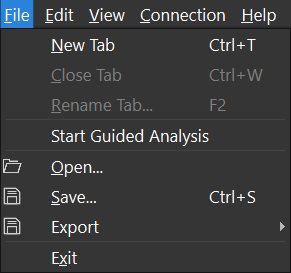
Most of these available options are related to common operations found in many different applications, however exporting PVRTune data is worth a quick explanation.
Export Data#
Exporting data may be useful for saving information in formats that can then be used by external applications. Subsequent analysis can then be performed outside of the PVRTune environment.
After selecting File → Export Data, the following options are available:
To export timing data to a CSV file, select “Export timing data to CSV…”;
To export calculated counter data to a CSV file, select “Export counters to CSV…”.
To export Properties for all tasks to a TXT file, select “Export Task Properties…”.
PVRTuneComplete has more export options available which can be found in Exporting Data in PVRTuneComplete.
Edit Menu in PVRTune#
The Edit menu provides options for editing user preferences and modifying other data.
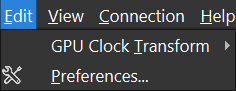
Preferences#
User preferences are set by selecting Edit → Preferences… in the Menu bar. This opens the Preferences dialog box which provides customisation options for PVRTune GUI.
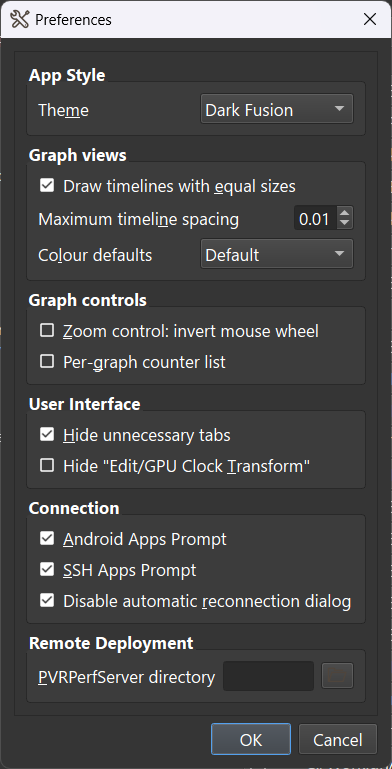
The Preferences dialog box contains several options:
App Style: This option allows the selection of the GUI theme. The available options are Default or Dark Fusion.
Graph views: This section allows the customisation of the graphs in the timeline.
Draw timelines with equal sizes: ome timelines contain multiple levels. If enabled, all timelines are drawn of an equal size, irrespective of timeline level counts.
Draw Marks across all timelines: This option is turned off by default but can be toggled to show up marks in the Timeline area.
Timeline Spacing: This option modifies the spacing between timelines. The padding between each timeline can be tweaked with a lower value equalling less padding and a higher value equalling more padding.
Colour defaults: This changes the colour set used for counters and PIDs.
Graph controls: The Zoom control: invert mouse wheel option in this sectio determines whether the mouse wheel can be used to zoom in and out of a graph in the Timeline area. With the option unchecked (default) scrolling down zooms into the area while scrolling up zooms out of it. This setting can be inverted via the checkbox.
User Interface: This section allows customisation of certain elements of the UI.
Integrate connection form: This option is available under the User Interface section of the Preferences dialog box. Unchecking this option turns the connection form into a pop-up window.
Hide unnecessary tabs: This option is available under the User Interface section of the Preferences dialog box. If unchecked, an individual tab is assigned for the connection form in the Timeline area. This provides quick access to the connection form after a connection is made or with a file loaded.
Hide “Edit/Clock Transform”: This sets the visibility of a menu option which controls the processing applied to the GPU clock. The clock speed can be automatically calculated by PVRTune, by the drivers, or input by the user as a fixed value.
Connection:
Android Apps Prompt: When connecting to an Android device PVRTune can automatically start an application on the device at the start of recording. Selecting this option will cause a prompt to appear during connection which will allow selection of an application.
SSH Apps Prompt: When connecting via SSH PVRTune can automatically start an application on the device at the start of recording. Selecting this option will cause a prompt to appear during connection which will allow selection of an application.
Disable automatic reconnection dialog: Prevents the Automatic Reconnection dialog window from being shown when a connection is lost.
Remote Deployment: The Select PVRPerfServer directory allows the selection of a custom version PVRPerfServer. This version will be deployed to the device during remote deployment.
View Menu in PVRTune#
The View menu provides options for finding information and showing or hiding the various windows present in the PVRTune GUI.
Note: The workspace can also be customised by dragging and dropping the individual dockable sections to any edge of the interface, or as standalone windows.
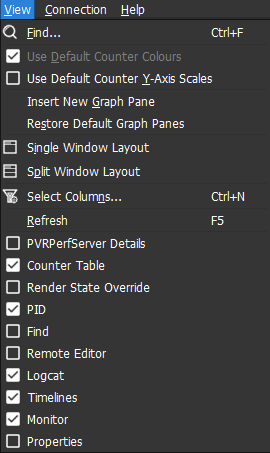
Find#
To initiate a search, select View → Find. This will open the Find window or jump to it. This window can then be used to search for required information.
For more details, see the section on the Find Window.
Use Default Counter Y-Axis Scales#
Selecting the Use Default Counter Y-Axis Scales option tells PVRTune to use its default Y-axis values for counters. The information appears in the Y Axis field in the Counter Properties window and affects the scale of graphed counters. Disabled if all counters are already using their default y-axis scale values.
Insert New Graph Pane#
This option allows adding a new graph within the selected view in the Timeline area. Graph panes share a horizontal scroll bar and zoom level.
Restore Default Graph Panes#
This option causes only the timing data and a default set of counters to display in the Timeline area, hiding additional graph panes. The timing data then occupies the full space within the Timeline area.
Single Window Layout#
To switch to a single window layout for the graph displayed in the Timeline area, toggle the option View -> Single Window Layout.
Split Window Layout#
To switch to a split window layout for the graph displayed in the Timeline area, toggle View -> Split Window Layout. This organises two graph views within the same tab, each with an independent horizontal scroll bar and zoom level.
Customise Counter Table Columns#
To customise the display of columns in the Counter Table window, select View -> Select Columns…. This will open a dialog box to allow the selection of the required columns.
Refresh PVRTune GUI#
The Refresh option reloads data and re-draws all objects in the GUI.
Show / Hide Elements of the GUI#
Elements of the GUI, including the Counter Table, Render State Override window, and so on, can be toggled by setting the appropriate option in the second half of the View menu.
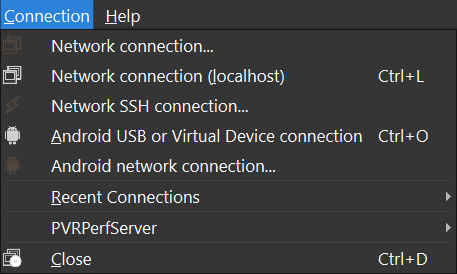
Connection Menu in PVRTune#
The Connection menu is used for connection management purposes. A number of options are available from this menu and these are covered in detail in the Connection Management section.
Help Menu in PVRTune#
The Help menu provides options for accessing the help, sending feedback, viewing general PVRTune release information, and checking for software updates.

View PVRTune User Manual#
The PVRTune Help option displays this document, the PVRTune User Manual, in a local browser.
Submit Feedback#
This will open a dialog box where instructions are displayed on how to send feedback and request support.
Check for Updates#
PVRTune checks for updates on startup. To force a check for software updates, this option can be used.
About PVRTune#
This option opens basic information about PVRTune release information such as versioning and contact details.