

Exporting Data in PVRTuneComplete
Export options can be found by navigating to the File menu and selecting Export Data. A selection of the types of data that can be exported are detailed below.
Note
To export to a CSV, use the “Export to CSV” option instead.
Raw Data
The raw data file contains the raw data that PVRTune uses to display timing and graphing details. Each row represents a single point in time and each column represents some specific item of data at that time.
A summary of all of the raw data values can be found in Summary of Exported Raw Data.
Timing Data
The timing data file contains similar information to the raw data file, but in a slightly more simplified form. For instance, no event or impulse data is included, and the nHW16ClockCnt value is replaced with a microsecond accurate time based on the host clock.
Active Counters
The first field is a microsecond-accurate time based on the host clock. Field two and onwards contain a mapping of which hardware counters map to which software counters. This is also used to track counter group changes as these alter the meaning of the values of Counter[0-N] in the raw data and timing data files.
Marks
The marks file contains three values:
A microsecond-accurate time based on the host clock;
The process ID of the application which sent the mark;
The value passed to PVRTune from PVRScope in the form of a string.
User Counters
This option creates a file containing the user-defined counters in CSV format. This data comes from an application which uses the PVRScope library.
User Timing Data
This option creates a file containing the user-defined timeline data in CSV format. This data comes from an application which uses the PVRScope library.
Counters
This option creates a file containing all of the currently available counters sampled over a user-specified time period (ms).
Counter Definitions
This option creates a file containing all counters and their corresponding definitions.
A summary of the counter definition values and their descriptions is found in Counter Definition Values.
Frame Timing Data
Non-PipeDM |
PipeDM |
|---|---|
|
|
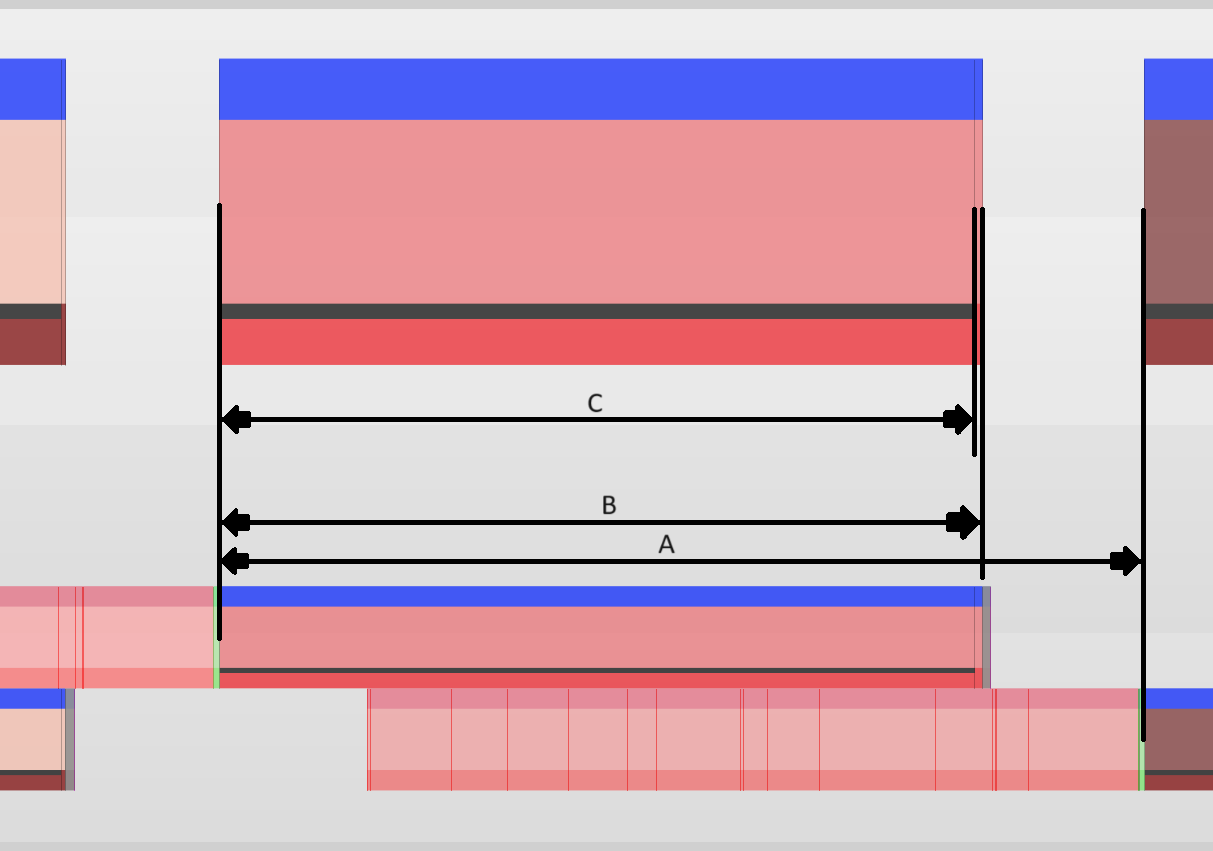
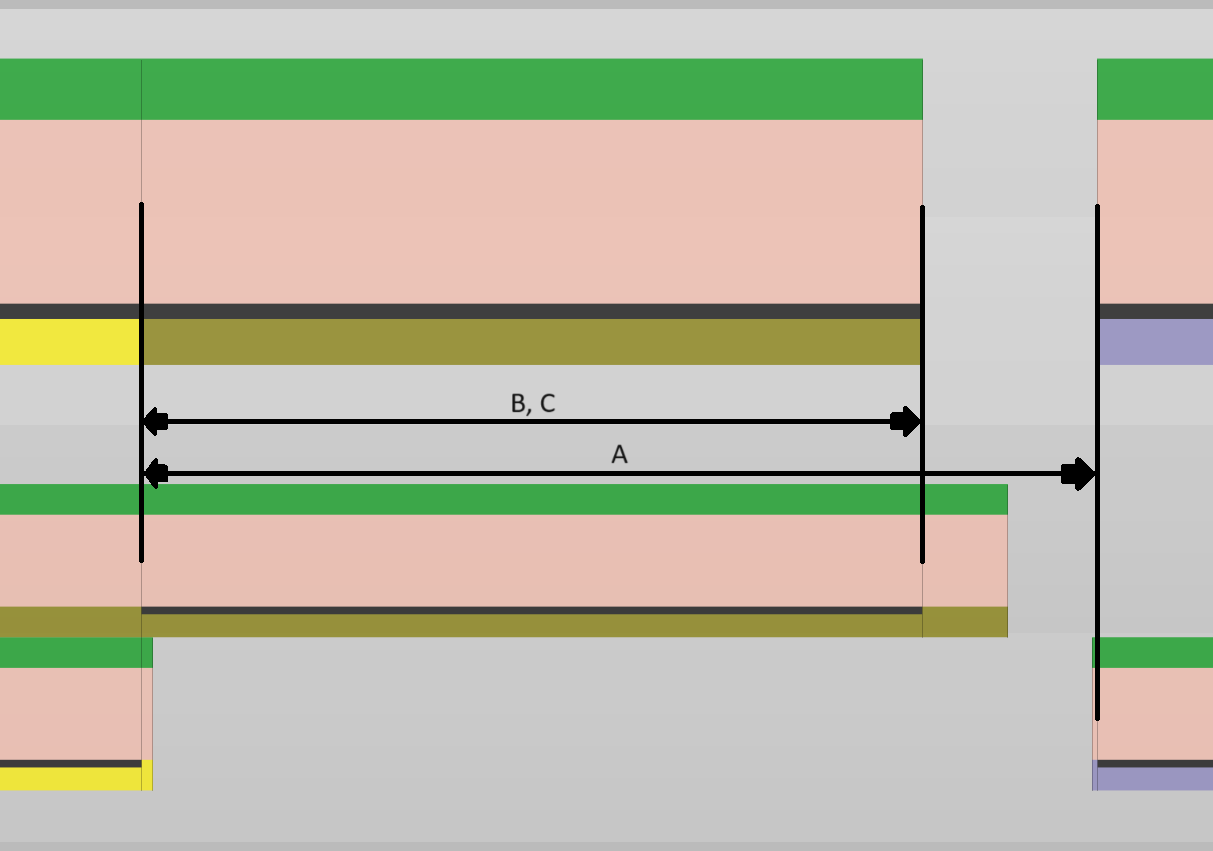
The Frame Timing Data file contains a row per frame, including information about data master (DM) clock cycles and bandwidth usage. This export is available in three forms; a 3D centric view, a more complete view that runs the processing per DM, and a verbose variant of the latter.
This table summarises the PVRTune frame timing data values and their descriptions.
Value |
Description |
|---|---|
DeviceID |
The Device ID is useful if there are multiple devices in the system. |
PID |
Unique process identifier, as reported by the operating system. |
Context |
Some APIs have a PID context. |
Frame |
The frame number as reported by the driver. |
3D FPS |
Frames per second, 1000/(3D time ms). |
3D time ms |
Summed time of each 3D task from start-to-start (period A) in frame, in milliseconds. |
3D cycles |
Summed clock cycles of each 3D task from start-to-start (period A) in frame. |
3D DM Cycles |
Sum of 3D Data Master active cycles (period C) for each 3D task in this frame. |
3D DM busy % |
Percentage of time the 3D Data Master was active during the frame. Calculated as (3D DM cycles, period C) / (3D cycles, period A). |
3D Timing Cycles |
Total number of 3D timing cycles (period B) during the frame. Includes firmware processing overheads. |
3D Timing busy % |
Percentage of time 3D timing tasks (including firmware processing overheads) were active during the frame. Calculated as (3D Timing Cycles, period B) / (3D cycles, period A). |
3D bandwidth Words |
Summed System Level Cache (SLC) read and write transactions (Words, can be converted to bytes) during each 3D task from start-to-start (period A) in frame. Includes any work running on other DMs in parallel to the 3D Data Master. |
Summary of Exported Raw Data Values in PVRTuneComplete
This table summarises the raw data values exported from PVRTuneComplete.
Value |
Description |
|---|---|
FWThread |
If the firmware is multithreaded, this indicates the thread ID that wrote the event. |
FWDataMaster |
See enum |
FrameNo |
The frame number of the application, whose data the given row represents. |
ExtJobRef |
Job reference value supplied by the client driver. |
IntJobRef |
Job reference value generated inside Services. |
OSID |
In virtualised environments, an ID indicating which OS caused the event. |
PID |
The process ID of the application, whose data the given row represents. |
DMCOnext |
Context handle for the HW data master. |
RTData |
RTData values represent the work target being used at the time the data was taken. The specific integer used is arbitrary and not meaningful. However, shared values across activities represent shared use of a work target across those activities. |
FWActHWRReason |
See enum |
TypePVRScope |
See enum |
Type4 |
See enum |
Ordinal |
This value represents the ID number of the packet sent from the driver to PVRTune. This number is incremented for every packet. Missing values indicate that the data has been lost. |
ClockBy16 |
This value represents a counter on the graphics core that increments once every 16 clock cycles. This is used to generate an estimate of the clock speed and to timestamp graphing and timing data. |
ClockBy256 |
This value represents a counter on the graphics core that increments once every 256 clock cycles. This is used to generate an estimate of the clock speed and to timestamp graphing and timing data. |
ClockSpeed |
This value represents the clock speed of the graphics as reported by the driver. |
CounterConfig |
Indicates that the data[0..N] values give a new counter configuration. |
CalibratedClockSpeed |
Hardware clock speed calculated by the firmware. |
OSTimeStampNS0 |
OS timestamp in nanoseconds: low 32-bits. |
OSTimeStampNS1 |
OS timestamp in nanoseconds: high 32-bits. |
CRTimeStampBy256 |
Hardware timestamp, reading of ClockBy256. |
OSTimeUS0 |
OS time in microseconds: low 32-bits. |
OSTimeUS1 |
OS time in microseconds: high 32-bits. |
data[0..N] |
Each of these fields represents the absolute value of the additional data carried by the event. In most events, these are the hardware counter readings. Knowing which counter source has been programmed into which counter is possible using the active counters CSV file. |
Counter Definition Values in PVRTuneComplete
This table summarises the PVRTune counter definition values and their descriptions which can be exported.
Value |
Description |
|---|---|
Source |
The folder name in PVRTune GUI Counter Table that the counter is placed under. |
Percentage |
A boolean value that is true if the counter value is a percentage that falls within the range 0.0 to 1.0, and false otherwise. |
SupportedFlags |
A value representing which hardware configurations the counter is supported on. |
Custom |
A boolean value that is true if the counter was defined by the user, and false otherwise. |
Y |
The default Y axis scaling value. |
Y Units |
The Y axis units that the counter value is measured in, such as seconds, bytes, or clock cycles. |
Equation |
The mathematical calculation that is used to derive the counter value. |
Desc |
A text description of the counter. |