Counter Table Window in PVRTune
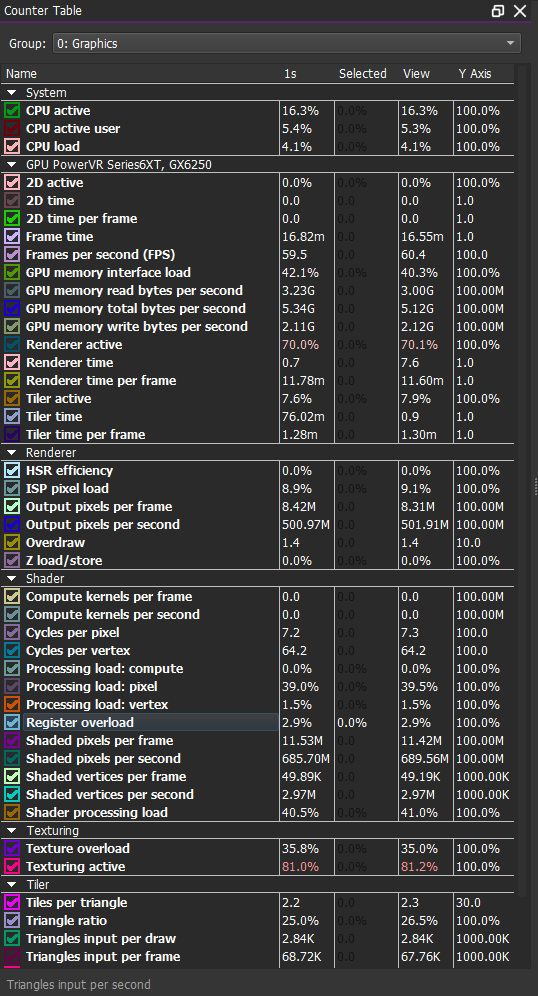
The Counter Table displays a list of all the currently available counters that can be displayed in the timing graph.
By default, the Counter Table window is placed in the top left of the GUI. The data which generates these counters can come from various sources such as the hardware, the firmware, the host operating system, or the driver.

Counters give detailed information about the current state of the device and application dynamics during any given moment (sample) of the profiling session, such as:
GPU Loads;
CPU Loads;
Memory Loads;
Frame Time;
Number of Polygons input/output to hardware;
Average number of cycles for shader programs;
Register pressure.
A counter can be shown or hidden on the timing graph by:
Selecting the coloured checkbox to the left of the table;
Right-clicking on a counter and selecting Show Selected (Ctrl + E);
Right-clicking on a counter and selecting Remove Counter;
Dragging a counter item into the graph window;
Hovering over a counter in the timing graph and pressing Del.
Selecting Display Columns in the Counter Table
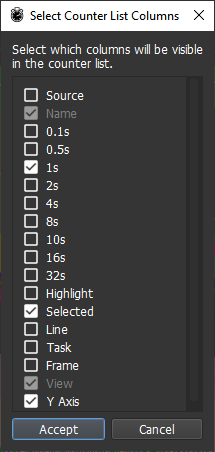
By default, counter data are tabulated following a similar format as shown in the Counter Table. Additional data sets can be customised for display by right-clicking the Counter Table window and choosing the Select Columns option, as shown below.

The table below shows a summary of the columns that can be selected and deselected on demand:
Column |
Description |
|---|---|
0.1s to 32s |
These values represent time frames. Columns show the average value of counters. For example, the 32s column gives the average over the last 32 seconds. |
Highlighted |
By hovering the mouse over a task, its time range is highlighted. This column shows the values of counters over that highlighted time range. |
Selected |
By selecting a time range and using this checkbox, it is possible to view the average over the selected region. |
Line |
This column responds to mouse hover. It shows the values of the counters at the time associated with the position of the mouse in the graph view. |
Task |
This column responds to mouse hover. It shows the average value of the counters over the time frame of a single Tiler or Renderer task. |
Frame |
This column responds to mouse hover. It shows the average value of given counters over the time frame of a single frame. |
View |
This column responds to mouse hover. It shows the average value of counters over the time frame of the graph which the cursor is currently over. |
Adding a Counter to the Graph View
Counters can be plotted against the timeline to give a graphical representation of their change over time. During connected analysis in the PVRTune GUI, counters are updated in realtime.
To add a counter to the graph view, perform the following steps:
Identify the counter of interest from the Counter Table window.
Drag and drop the counter from the Counter Table window to an existing graph present in the Timeline area.
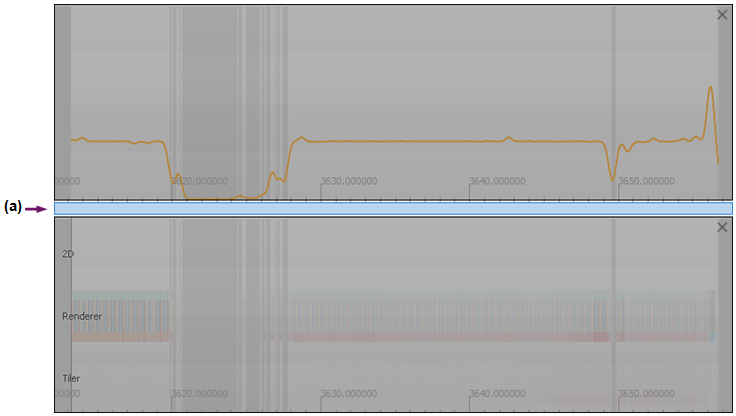
This results in the addition of new plotted data on the graph. The image below shows an example where the frames per second counter, represented by the line graph, has been added to a graph view with rendered timing data.

After this, a new graph can be created by dragging and dropping a counter to a graph placeholder available in the Timeline area. A graph placeholder is the narrow area of space located above or below a graph view. This is shown by (a) in the image below.

Removing a Counter from the Graph View
Counters plotted in the graph view can be removed when they are no longer required. To remove a counter from the graph view, perform the following steps:
In the Timeline area, identify the counter to be removed.
Select the graph line corresponding to the counter by clicking on it.
Press Del to remove the plotted counter data from the graph. The same action can be achieved by right-clicking the counter plot and selecting the Remove Counter option from the action menu.
PVRTrace Software Counters
Note
The final release of PVRTrace was in the 2019 2nd Release. In order to access these counters, a previous version of the PowerVR Tools and SDK must be downloaded from the Previous Releases page.
An application can send custom software counters to PVRTune via PVRScope. When an application is being profiled by PVRTrace, the corresponding software counters sent to PVRTune using PVRScope provide data on certain statistics within the running application.
Enabling PVRTrace Software Counters
The approach to enabling these counters on Android, Linux, QNX, and Windows is as follows:
Android
Using PVRTrace on Android requires PVRHub. In the Options screen, ensure that the setting Enable Software Counters is enabled. PVRTrace Recording Libraries must be installed on the device for this to work.
Note
As with PVRTrace, the final release of PVRHub was in the 2019 2nd Release. In order to use these software counters on Android, a previous version of the PowerVR Tools and SDK must be installed.
Linux
With PVRHub installed, run pvr_profile <binary> where <binary> is the application that is required to be profiled with software counters active.
QNX and Windows
In the pvrtraceconfig.json file on the device, ensure that for Profiling the SoftwareCounters and Enabled options are set to true.
PVRTrace Software Counters
This table lists the software counters that are available from the PVRTrace libraries.
Software counter |
|---|
Indexed draw calls |
Non-index draw calls |
Points no. |
Line no. (list) |
Line no. (loop) |
Line no. (strip) |
Total line no. |
Triangle no. (list) |
Triangle no. (strip) |
Triangle no. (fan). |
Total triangle no. |
Texture uploads |
Texture modifications |
Scissor calls |
Viewport calls |
Framebuffer accesses |
Vertex shader compiles |
Fragment shader compiles |
Program links |
Framebuffer access (bytes) |
Texture uploads (bytes) |
Texture modifications (bytes) |
Buffer object uploads (bytes) |
Buffer object modifications (bytes) |
Uniform Uploads |
Context binds |
Shader proportion: pixel |
Shader proportion: vertex |
Shader proportion: compute |
Vertices per batch |
Shader slot scheduled count: compute |
Shader slot scheduled count: pixel |
Shader slot scheduled count: vertex |
Shader slot size: pixel |
Shader slot size: vertex |

