Identifying Bottlenecks
The ability to identify bottlenecks is vital when analysing the performance of an application. Previously, the Monitor window and the Render State Override window sections explained how they can be used to help identify some types of bottlenecks by monitoring graphics core workloads and render state.
This section explains how to identify bottlenecks using the graph view. Applications usually have bottlenecks in one of five categories.
Identifying CPU-Limited Application Using PVRTune
A CPU-limited application is often identifiable by poor performance or frame rate, even when the graphics core usage is not high.
This CPU-limited application can be very easily identified in PVRTune when the CPU load is either at or near one hundred percent - see (a) on the graph below. Another common indicator is widely variable CPU load.
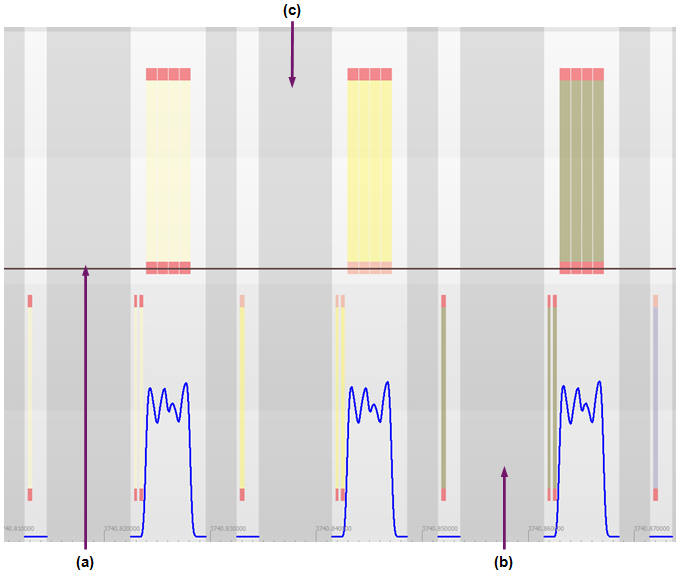
Other identifying factors include:
Gaps in the shader load, caused by the PowerVR hardware going to sleep while waiting for further instructions - see (b) above.
Regular visible gaps between frames when displaying timing data - see (c) above.
Identifying Vertex-Limited Applications Using PVRTune
Vertex-limited applications occur when processing either large amounts of vertices per frame, or from the use of a complex vertex shader, or both. This acts as a bottleneck for the application.
This type of bottleneck can be identified by large gaps between renderer tasks (a) in the graph below - while there is little or no gap between tiler tasks (b) in the graph below.
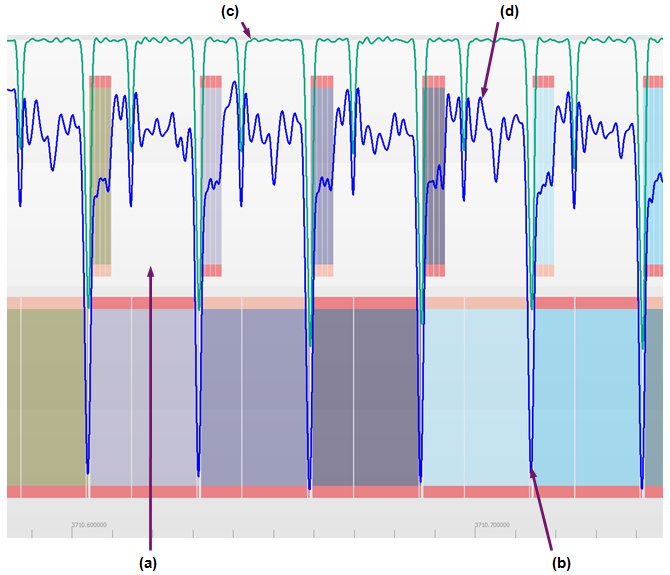
The bottleneck can be defined further by comparing the Processing Load: Vertex and Tiler Active counters.
If Tiler Active is high - (c) in the graph above - but Processing Load: Vertex is not, then the scene has too many vertices in it and the cost is coming from the tiling process.
If Processing Load: Vertex is high - see (d) in the graph above - but Tiler Active is not, then the bottleneck is likely to be in the vertex shader.
Identifying V-Sync-Limited Applications Using PVRTune
Vertical Synchronisation (V-Sync) is a display option that forces an application to synchronise graphical updates with the update rate of the screen. This causes some frames to be slightly delayed and enforces a maximum refresh rate, but reduces screen tearing and can save power.
V-Sync-limited applications are often characterised by intermittent gaps between frames in the graph view, and the frame rate appears to be limited at a set maximum value.
If possible, V-Sync should be disabled when profiling an application as it adds noise to the PVRTune output. This makes it more difficult to diagnose where optimisation work could be beneficial, or if completed optimisation has been successful.
Identifying Fragment-Limited Applications Using PVRTune
Fragment-limited applications are very common and occur in most scenes that have fewer vertices than the number of pixels in the frame buffer.
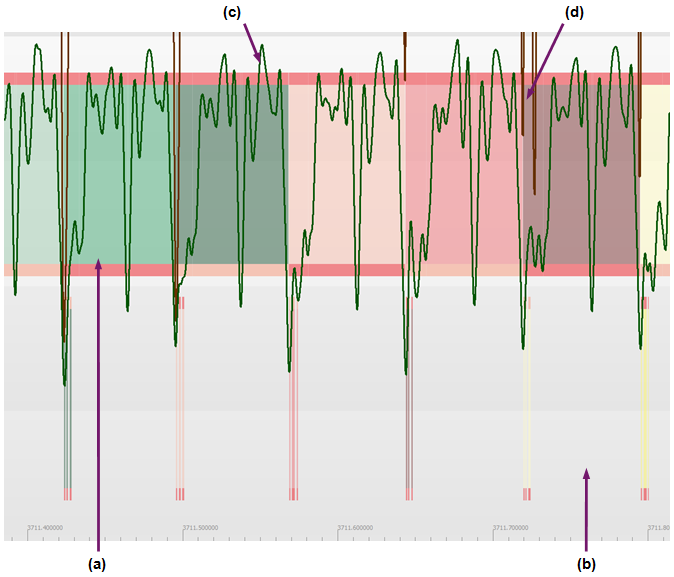
Fragment-limited applications can be identified by:
no gaps between Renderer tasks - shown in (a);
large gaps between Tiler tasks - shown in (b);
high Processing Load: Pixel values - shown in (c);
high shader clock cycles per pixel - shown in (d).
Identifying Bandwidth-Limited Applications Using PVRTune
Cases of bandwidth-limited applications are hard to visualise and identify, as they may appear as other bottlenecks. Applications may be bandwidth-limited if:
The Timeline shows the application to be fragment-limited but the Processing Load: Pixel is low;
The Timeline shows the application to be vertex-limited but the Processing Load: Vertex and the Tiler Active are low.
Other instances of bandwidth limitation may occur. For example, if many units are accessing memory simultaneously then the available system memory bandwidth limits can slow all operations on the hardware. This is platform-specific, so there is no counter to record it.
Action should always be taken to reduce bandwidth use whenever possible through use of texture compression, mesh optimisation, and by avoiding unnecessary texture reads.
Note
Bandwidth in System-on-Chip (SoC) devices is shared amongst all components of the chip. Non-graphics processor areas of the chip using large amounts of bandwidth may still cause application graphics to be bandwidth-limited.
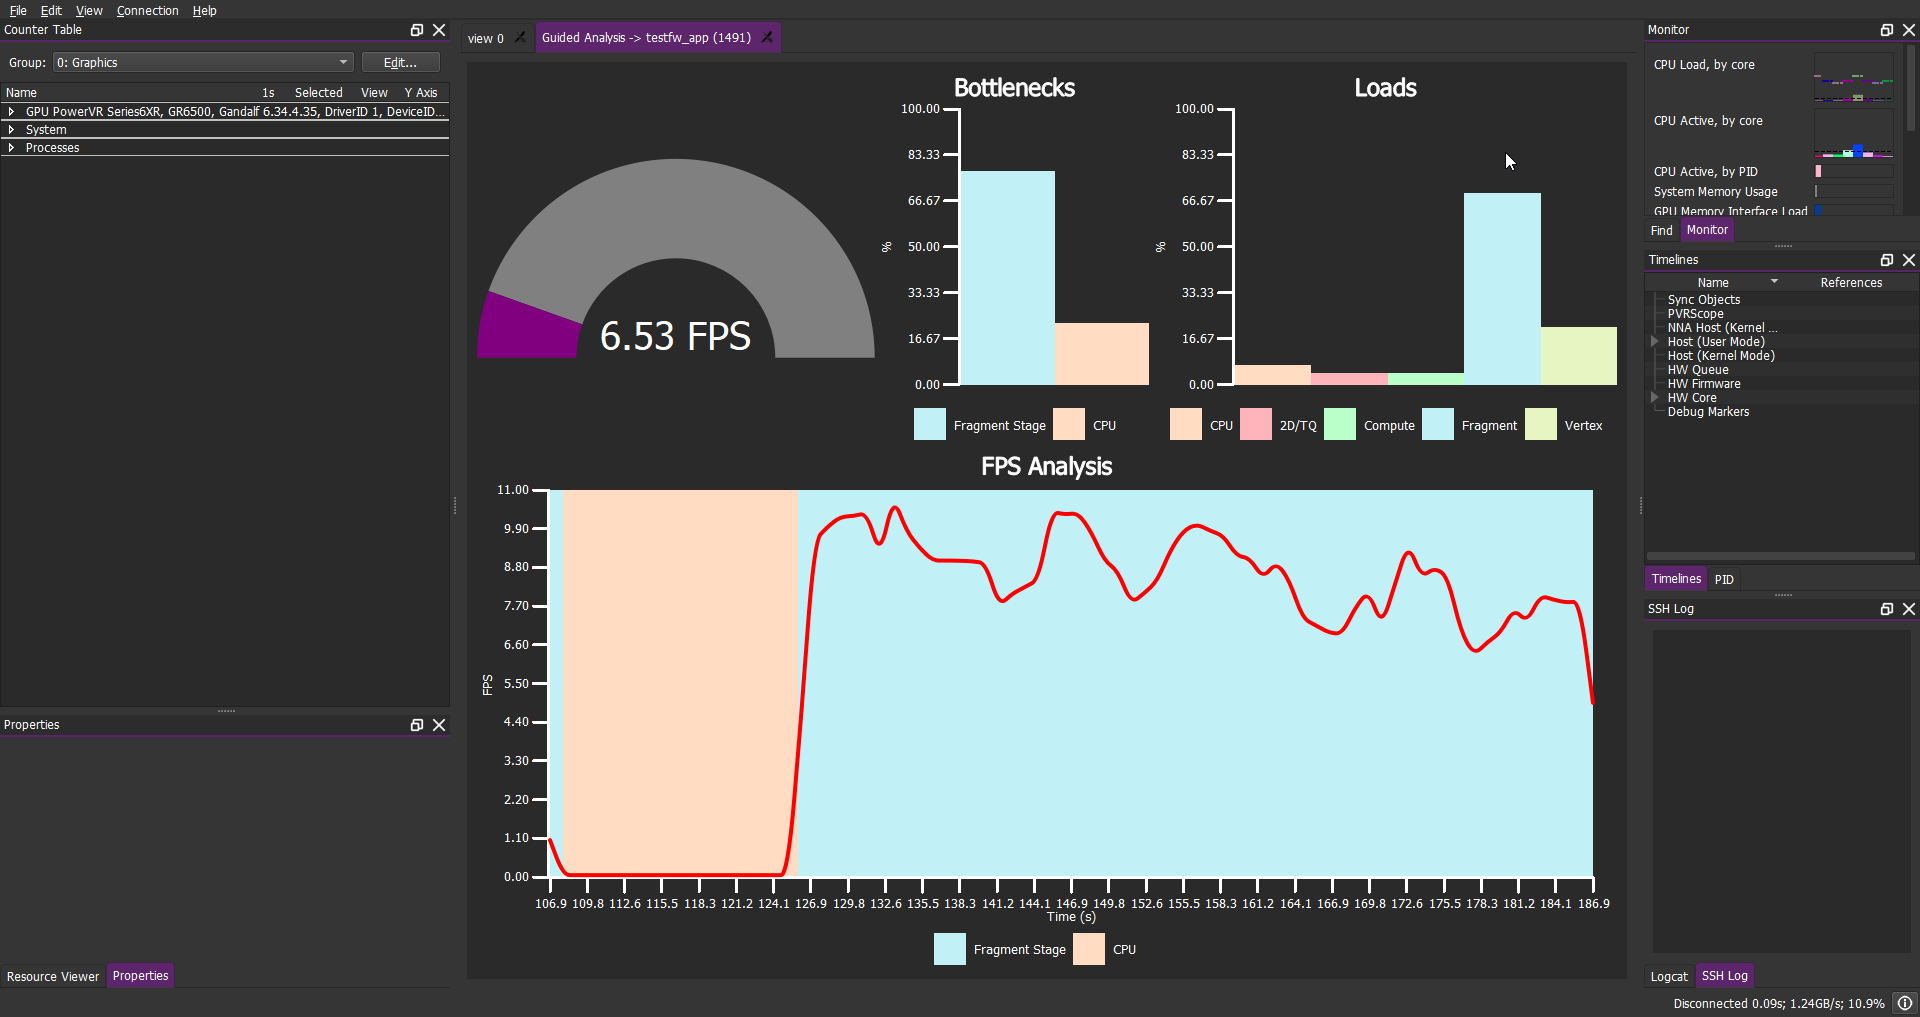
Guided Analysis in PVRTune
PVRTune also has some low-level guided analysis built in that allows you to quickly evaluate a recording of a session, highlighting potential bottlenecks that have been observed in the session, and provides a detailed breakdown of those bottlenecks.
Guided analysis cannot be performed on live data streams. Ensure that the connection has been closed, or a pre-recorded file is loaded into the GUI before beginning analysis. The option will also remain greyed out if there is only one PID (i.e. PVRPerfServer) in the file; ensure the recording includes a program which uses the GPU.
The analysis view can be accessed by selecting File → Start Guided Analysis from the Menu bar while data is loaded in the GUI.
Data will be presented through a new tab on the main screen. This will provide you with some basic statistics of the recorded performance.
The graph at the bottom provides the most data. By mousing over the regions, a tooltip showing the frame range appears, whereas hovering over the curve gives the exact FPS value at that frame. Clicking on a region of the graph will provide a more detailed breakdown of that process (vertex, fragment, or compute). Use CTRL + left click on a region to go to the main graph view, highlighted onto the selected region.