Analyzing Code
Analyzing Code
You can use the code analysis tools in the Debug mode. To switch to Debug mode, select Debug in the mode selector, or select the Analyze menu and then select a tool. When you are in the Debug mode, you can switch between tools by selecting them in the menu on the toolbar.
You can drag and drop the views in the Debug mode to new positions on the screen. The size and position of views are saved for future sessions. Select Window > Views > Reset to Default Layout to reset the views to their original sizes and positions.
You can use the following code analysis tools in the Debug mode:
-
You can detect problems in memory management by using the Memcheck tool and find cache misses in the code by using the Callgrind tool.
-
You can analyze the CPU usage of embedded applications and Linux desktop applications with the Performance Analyzer that integrates the Linux Perf tool.
Using Valgrind Code Analysis Tools
PVRStudio integrates Valgrind code analysis tools <http://valgrind.org/info/tools.html> for detecting memory leaks and profiling function execution. You must download and install them separately to use them from PVRStudio.
You can run the Valgrind tools either locally on the development host or remotely on another host. You can use them to analyze both applications for which you set up a project in PVRStudio and applications for which you do not have a project.
Valgrind tools are supported locally only on Linux and macOS. However, according to Valgrind.org, support on macOS 10.8 and 10.9 is experimental and mostly broken. You can run the tools on a remote Linux machine or device from any development host.
To run the Valgrind tools to analyze an application for which you have a project, open the project in PVRStudio and select the kit to run the project. The kit specifies whether the Valgrind tools are run locally or remotely.
For more information about analyzing applications for which you do not have a project, see Running Valgrind Tools on External Applications.
To select options for the Valgrind tools, select Tools > Options > Analyzer. You can override the general settings for each project in the Run Settings for the project.
The following sections describe how to use the Valgrind tools:
Detecting Memory Leaks with Memcheck Profiling Function Execution <Profiling Function Execution>
Detecting Memory Leaks with Memcheck
You can use the Memcheck tool included in the Valgrind tool suite to detect problems that are related to memory management in applications. You can use the tool together with the GDB debugger. When a problem is detected, the application is interrupted and you can debug it.
Note: You can install and run Memcheck locally on Linux. You can run it on a remote host or device from any development machine. On Windows, you can use the Heob heap observer to receive similar results.
After you download and install Valgrind tools, you can use Memcheck from PVRStudio.
To analyze applications:
In the Projects mode, select a debug build configuration.
Select Debug to open the Debug mode, and then select Memcheck on the toolbar.
Select the image:: images/pvrstudio-analyze-start-button.png button to start the application.
Use the application to analyze it.
Select the image:: images/stop_small.png button to view the results of the analysis in the Analysis view.
While the application is running, Memcheck checks all reads and writes of memory and intercepts calls that allocate or free memory or create or delete memory blocks. The results are displayed when you stop Memcheck. Click a line to view where a memory leak occurred and a stack trace that shows what caused it.

Move the mouse on a row to view more information about the function.
For more information about using Memcheck, see Interpreting Memcheck’s Output in the Valgrind documentation.
Selecting Options for Memory Analysis
You can specify analyzer settings either globally for all projects or separately for each project in the run settings of the project.
Stack traces can get quite large and confusing, and therefore, reading them from the bottom up can help. If the stack trace is not big enough or it is too big, select Tools > Options > Analyzer and define the length of the stack trace in the Backtrace frame count field.
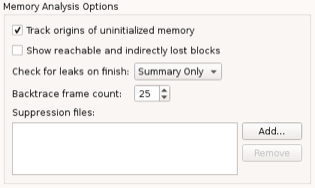
Memcheck also reports uses of uninitialised values, most commonly with the message Conditional jump or move depends on uninitialised value(s). To determine the root cause of these errors, the Track origins of uninitialized memory check box is selected by default. You can deselect it to make Memcheck run faster.
Memcheck searches for memory leaks when the client application finishes. To view the amount of leaks that occurred, select Summary Only in the Check for leaks on finish field. To also view details of each leak, select Full.
Showing Reachable and Indirectly Lost Blocks
Reachable blocks are blocks that are pointed at by a pointer or chain of pointers and that might have been freed before the application exited. Indirectly lost blocks are considered lost because all the blocks that point to them are themselves lost. For example, all the children of a lost root node are indirectly lost.
By default, Memcheck does not report reachable and indirectly lost blocks. To have them reported, select the Show reachable and indirectly lost blocks.
Suppressing Errors
Memcheck detects numerous problems in the system libraries, such as the C library, which come pre-installed with your OS. As you cannot easily fix them, you want to suppress them. Valgrind reads a list of errors to suppress at startup. A default suppression file is created by the ./configure script when the system is built.
You can write your own suppression files if parts of your project contain errors you cannot fix and you do not want to be reminded of them. Click Add in the Memory Analysis dialog to add the suppression files. For more information about writing suppression files, see Suppressing Errors in the Valgrind documentation.
Profiling Function Execution
You can use the Callgrind tool included in the Valgrind tool suite to detect problems that are related to executing functions. In addition, you can load the data files generated by Callgrind into the KCachegrind profile data visualization tool for browsing the performance results.
After you download and install Valgrind tools and KCachegrind, you can use Callgrind and KCachegrind from PVRStudio.
Note: You can install and run Callgrind and KCachegrind locally on Linux. You can run Callgrind on a remote Linux machine or device from any development machine.
To analyze applications:
In the Projects mode, select a release build configuration.
Select Debug to open the Debug mode, and then select Callgrind on the toolbar.
Select the image:: images/pvrstudio-analyze-start-button.png button to start the application.
Use the application to analyze it.
Select the image:: images/stop_small.png button to view the results of the analysis in the Profile view.
Callgrind records the call history of functions that are executed when the application is run. It collects the number of instructions that are executed, their relationship to source lines, the relationships of the caller and callee between functions, and the numbers of such calls. You can also use cache simulation or branch prediction to gather information about the runtime behavior of an application.
Double-click a function to view information about the calling functions in the Callers view and about the called functions in the Callees view.
Since the run-time characteristics of debug and release build configurations differ significantly, analytical findings for one build configuration may not be relevant for the other. Profiling a debug build often finds a major part of the time being spent in low-level code, such as container implementations, while the same code does not show up in the profile of a release build of the same application due to inlining and other optimizations typically done there.
Many recent compilers allow you to build an optimized application
with debug information present at the same time. For example, typical
options for GCC are: -g -O2. It is advisable to use such a setup
for Callgrind profiling.

To view the data in KCachegrind, select the kcachegrind button. (Open Results in KCachegrind) button on the toolbar. PVRStudio launches KCachegrind and loads the data into it for visualization.
Selecting Profiling Options
You can specify analyzer settings either globally for all projects or separately for each project in the run settings of the project.
To specify settings for Valgrind, select Tools > Options > Analyzer. The Profiling Options group contains Callgrind options.
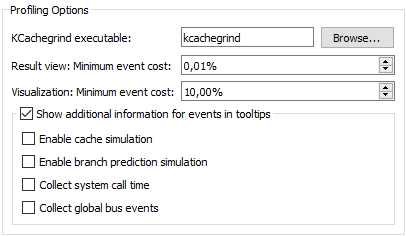
In the KCachegrind executable field, enter the path to the KCachegrind executable to launch.
In the Result view: Minimum event cost field, limit the amount of results the profiler gives you to increase profiler performance.
You can collect information about the system call times and the
number of global bus events of the event type Ge that are
executed.
Enabling Full Cache Simulation
By default, only instruction read accesses (Ir) are counted. To fully simulate the cache, select the Enable cache simulation check box. This enables the following additional event counters:
Cache misses on instruction reads (I1mr/I2mr)
Data read accesses (Dr) and related cache misses (D1mr/D2mr)
Data write accesses (Dw) and related cache misses (D1mw/D2mw)
Enabling Branch Prediction Simulation
To enable the following additional event counters, select the Enable branch prediction simulation check box:
Number of conditional branches executed and related predictor misses (Bc/Bcm)
Executed indirect jumps and related misses of the jump address predictor (Bi/Bim)
Running Valgrind Tools on External Applications
PVRStudio integrates Valgrind code analysis tools for detecting memory leaks and profiling function execution.
To run the Valgrind tools to analyze external applications for which you do not have a PVRStudio project:
Select Analyze > Valgrind Memory Analyzer (External Application) or Valgrind Function Profiler (External Application).
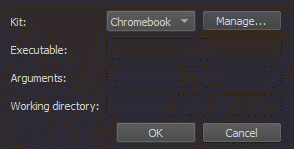
Specify the application to run and analyze, and the kit to use.
Analyzing CPU Usage
PVRStudio is integrated with the Linux Perf tool that can be used to analyze the CPU and memory usage of an application on embedded devices and, to a limited extent, on Linux desktop platforms. The Performance Analyzer uses the Perf tool bundled with the Linux kernel to take periodic snapshots of the call chain of an application and visualizes them in a timeline view or as a flame graph.
Using the Performance Analyzer
The Performance Analyzer usually needs to be able to locate debug symbols for the binaries involved.
Profile builds produce optimized binaries with separate debug symbols and should generally be used for profiling.
To manually set up a build configuration to provide separate debug symbols, edit the project build settings:
To generate debug symbols also for applications compiled in release mode, select Projects, and then select Details next to Build Steps to view the build steps.
Select the Generate separate debug info check box.
Select Yes to recompile the project.
You can start the Performance Analyzer in the following ways:
Select Analyze > Performance Analyzer to profile the current application.
Select the image:: images/pvrstudio-analyze-start-button.png (Start) button to start the application from the Performance Analyzer.
Note: If data collection does not start automatically, select the image:: images/recordfill.png (Collect profile data) button.
When you start analyzing an application, the application is launched, and the Performance Analyzer immediately begins to collect data. This is indicated by the time running in the Recorded field. However, as the data is passed through the Perf tool and an extra helper program bundled with PVRStudio, and both buffer and process it on the fly, data may arrive in PVRStudio several seconds after it was generated. An estimate for this delay is given in the Processing delay field.
Data is collected until you select the Stop collecting profile data button or terminate the application.
Select the Stop collecting profile data button to disable the automatic start of the data collection when an application is launched. Profile data will still be generated, but PVRStudio will discard it until you select the button again.
Profiling Memory Usage on Devices
To create trace points for profiling memory usage on a target device, select Analyze > Performance Analyzer Options > Create Memory Trace Points.
To add events for the trace points, see Choosing Event Types
You can record a memory trace to view usage graphs in the samples rows of the timeline and to view memory allocations, peaks, and releases in the flame graph.
Specifying Performance Analyzer Settings
To specify global settings for the Performance Analyzer, select Tools > Options > Analyzer > CPU Usage. For each run configuration, you can also use specialized settings. Select Projects > Run, and then select Details next to Performance Analyzer Settings.
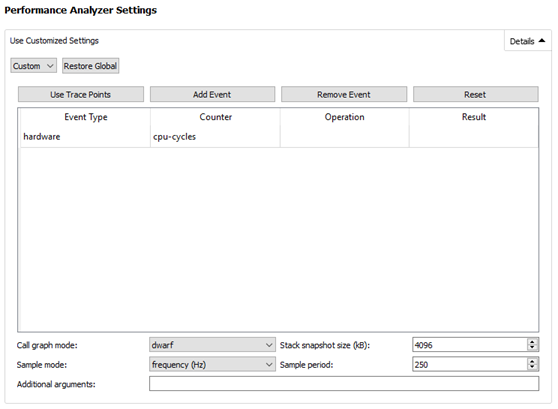
To edit the settings for the current run configuration, you can also select the dropdown menu next to the Collect profile data button.
Choosing Event Types
In the Events table, you can specify which events should trigger the Performance Analyzer to take a sample. The most common way of analyzing CPU usage involves periodic sampling, driven by hardware performance counters that react to the number of instructions or CPU cycles executed. Alternatively, a software counter that uses the CPU clock can be chosen.
Select Add Event to add events to the table. In the Event Type column, you can choose the general type of event to be sampled, most commonly hardware or software. In the Counter column, you can choose which specific counter should be used for the sampling. For example, instructions in the hardware group or cpu-clock in the software group.
More specialized sampling, for example by cache misses or cache hits, is possible. However, support for it depends on specific features of the CPU involved. For those specialized events, you can give more detailed sampling instructions in the Operation and Result columns. For example, you can choose a cache event for L1-dcache on the load operation with a result of misses. That would sample L1-dcache misses on reading.
Select Remove Event to remove the selected event from the table.
Select Use Trace Points to replace the current selection of
events with trace points defined on the target device and set the
Sample mode to event count and the Sample period to
1. If the trace points on the target were defined using the
Create Trace Points option, the Performance Analyzer will
automatically use them to profile memory usage.
Select Reset to revert the selection of events, as well as the Sample mode and Sample period to the default values.
Choosing a Sampling Mode and Period
In the Sample mode and Sample period fields, you can specify how samples are triggered:
Sampling by event count instructs the kernel to take a sample every
ntimes one of the chosen events has occurred, wherenis specified in the Sample period field.Sampling by frequency (Hz) instructs the kernel to try and take a sample
ntimes per second, by automatically adjusting the sampling period. Specifynin the Sample period field.
High frequencies or low event counts result in more accurate data, at the expense of a higher overhead and a larger volume of data being generated. The actual sampling period is determined by the Linux kernel on the target device, which takes the period set for Perf merely as advice. There may be a significant difference between the sampling period you request and the actual result.
In general, if you configure the Performance Analyzer to collect more data than it can transmit over the connection between the target and the host device, the application may get blocked while Perf is trying to send the data, and the processing delay may grow excessively. You should then change the Sample period or the Stack snapshot size.
Selecting Call Graph Mode
In the Call graph mode field, you can specify how the Performance Analyzer recovers call chains from your application:
The Frame Pointer, or
fp, mode relies on frame pointers being available in the profiled application and will instruct the kernel on the target device to walk the chain of frame pointers in order to retrieve a call chain for each sample.The Dwarf mode works also without frame pointers, but generates significantly more data. It takes a snapshot of the current application stack each time a sample is triggered and transmits that snapshot to the host computer for analysis.
The Last Branch Record mode does not use a memory buffer. It automatically decodes the last 16 taken branches every time execution stops. It is supported only on recent Intel CPUs.
Most system libraries are compiled without frame pointers by default, so the frame pointer mode is only useful with customized systems.
Setting Stack Snapshot Size
The Performance Analyzer will analyze and unwind the stack snapshots generated by Perf in dwarf mode. Set the size of the stack snapshots in the Stack snapshot size field. Large stack snapshots result in a larger volume of data to be transferred and processed. Small stack snapshots may fail to capture call chains of highly recursive applications or other intense stack usage.
Adding Command Line Options For Perf
You can specify additional command line options to be passed to Perf
when recording data in the Additional arguments field. You may
want to specify --no-delay or --no-buffering to reduce the
processing delay. However, those options are not supported by all
versions of Perf and Perf may not start if an unsupported option is
given.
Resolving Names for JIT-compiled JavaScript Functions
Some libraries can generate perf.map files with information about JavaScript functions. The Performance Analyzer will read them and show the function names in the Timeline, Statistics, and Flame Graph views. This only works if the process being profiled is running on the host computer, not on the target device.
Analyzing Collected Data
The Timeline view displays a graphical representation of CPU usage per thread and a condensed view of all recorded events.
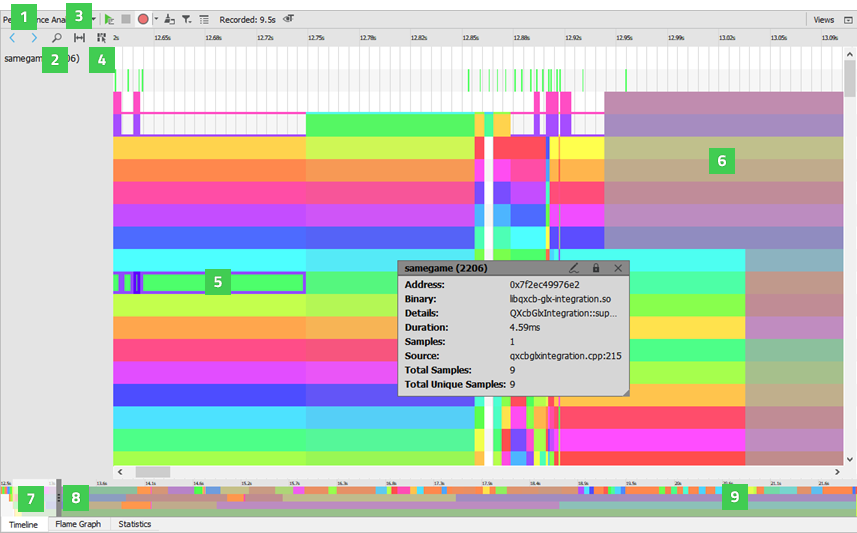
Each category in the timeline describes a thread in the application. Move the cursor on an event (5) on a row to see how long it takes and which function in the source it represents. To display the information only when an event is selected, disable the View Event Information on Mouseover button (4).
The outline (9) summarizes the period for which data was collected. Drag the zoom range (7) or click the outline to move on the outline. You can also move between events by selecting the Jump to Previous Event and Jump to Next Event buttons (1).
Select the Show Zoom Slider button (2) to open a slider that you can use to set the zoom level. You can also drag the zoom handles (8). To reset the default zoom level, right-click the timeline to open the context menu, and select Reset Zoom.
Selecting Event Ranges
You can select an event range (6) to view the time it represents or to zoom into a specific region of the trace. Select the Select Range button (3) to activate the selection tool. Then click in the timeline to specify the beginning of the event range. Drag the selection handle to define the end of the range.
You can use event ranges also to measure delays between two subsequent events. Place a range between the end of the first event and the beginning of the second event. The Duration field displays the delay between the events in milliseconds.
To zoom into an event range, double-click it.
To remove an event range, close the Selection dialog.
Understanding the Data
Generally, events in the timeline view indicate how long a function call took. Move the mouse over them to see details. The details always include the address of the function, the approximate duration of the call, the ELF file the function resides in, the number of samples collected with this function call active, the total number of times this function was encountered in the thread, and the number of samples this function was encountered in at least once.
For functions with debug information available, the details include the location in source code and the name of the function. You can click on such events to move the cursor in the code editor to the part of the code the event is associated with.
As the Perf tool only provides periodic samples, the Performance Analyzer cannot determine the exact time when a function was called or when it returned. You can, however, see exactly when a sample was taken in the second row of each thread. The Performance Analyzer assumes that if the same function is present at the same place in the call chain in multiple consecutive samples, then this represents a single call to the respective function. This is, of course, a simplification. Also, there may be other functions being called between the samples taken, which do not show up in the profile data. However, statistically, the data is likely to show the functions that spend the most CPU time most prominently.
If a function without debug information is encountered, further unwinding of the stack may fail. Unwinding will also fail for some symbols implemented in assembly language. If unwinding fails, only a part of the call chain is displayed, and the surrounding functions may seem to be interrupted. This does not necessarily mean they were actually interrupted during the execution of the application, but only that they could not be found in the stacks where the unwinding failed.
Kernel functions included in call chains are shown on the third row of each thread.
The coloring of the events represents the actual sample rate for the specific thread they belong to, across their duration. The Linux kernel will only take a sample of a thread if the thread is active. At the same time, the kernel tries to honor the requested event period. Thus, differences in the sampling frequency between different threads indicate that the thread with more samples taken is more likely to be the overall bottleneck, and the thread with less samples taken has likely spent time waiting for external events such as I/O or a mutex.
Viewing Statistics
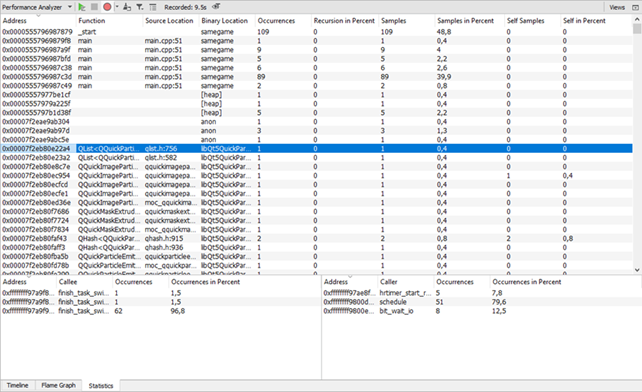
The Statistics view displays the number of samples each function
in the timeline was contained in, in total and when on the top of the
stack (called self). This allows you to examine which functions
you need to optimize. A high number of occurrences might indicate
that a function is triggered unnecessarily or takes very long to
execute.
Click on a row to move to the respective function in the source code in the code editor.
The Callers and Callees panes show dependencies between functions. They allow you to examine the internal functions of the application. The Callers pane summarizes the functions that called the function selected in the main view. The Callees pane summarizes the functions called from the function selected in the main view.
Click on a row to move to the respective function in the source code in the code editor and select it in the main view.
To copy the contents of one view or row to the clipboard, select Copy Table or Copy Row in the context menu.
Visualizing Statistics as Flame Graphs
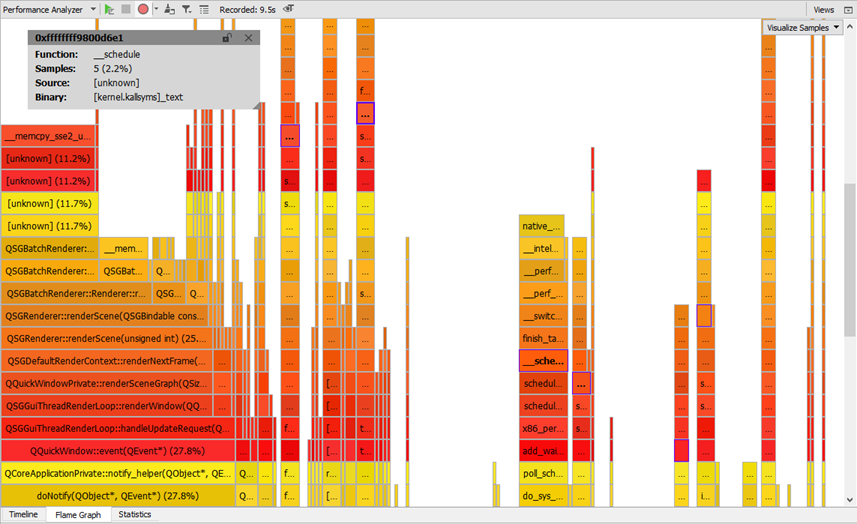
The Flame Graph view shows a more concise statistical overview of the execution. The horizontal bars show an aspect of the samples taken for a certain function, relative to the same aspect of all samples together. The nesting shows which functions were called by which other ones.
The Visualize button lets you choose what aspect to show in the Flame Graph.
Samples is the default visualization. The size of the horizontal bars represents the number of samples recorded for the given function.
In Peak Usage mode, the size of the horizontal bars represents the amount of memory allocated by the respective functions, at the point in time when the allocation’s memory usage was at its peak.
In Allocations mode, the size of the horizontal bars represents the number of memory allocations triggered by the respective functions.
In Releases mode, the size of the horizontal bars represents the number of memory releases triggered by the respective functions.
The Peak Usage, Allocations, and Releases modes will only show any data if samples from memory trace points have been recorded.
Interaction between the views
When you select a stack frame in either of the Timeline, Flame Graph, or Statistics views, information about it is displayed in the other two views. To view a time range in the Statistics and Flame Graph views, select Analyze > Performance Analyzer Options > Limit to the Range Selected in Timeline. To show the full stack frame, select Show Full Range.
Loading Perf Data Files
You can load any perf.data files generated by recent versions of
the Linux Perf tool and view them in PVRStudio. Select Analyze >
Performance Analyzer Options > Load perf.data to load a file.
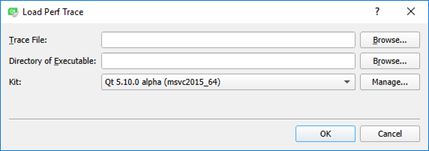
The Performance Analyzer needs to know the context in which the data was recorded to find the debug symbols. Therefore, you have to specify the kit that the application was built with and the folder where the application executable is located.
The Perf data files are generated by calling perf record. Make
sure to generate call graphs when recording data by starting Perf
with the --call-graph option. Also check that the necessary debug
symbols are available to the Performance Analyzer, either at a
standard location (/usr/lib/debug or next to the binaries).
The Performance Analyzer can read Perf data files generated in either
frame pointer or dwarf mode. However, to generate the files
correctly, numerous preconditions have to be met. Check whether Perf
can read back its own data in a sensible way by checking the output
of perf report or perf script for the recorded Perf data
files.
Loading and Saving Trace Files
You can save and load trace data in a format specific to the Performance Analyzer with the respective entries in Analyze > Performance Analyzer Options. This format is self-contained, and therefore loading it does not require you to specify the recording environment. You can transfer such trace files to a different computer without any tool chain or debug symbols and analyze them there.
Troubleshooting
The Performance Analyzer might fail to record data for the following reasons:
Perf events may be globally disabled on your system. The preconfigured Boot to Qt images come with perf events enabled. For a custom configuration you need to make sure that the file
/proc/sys/kernel/perf_event_paranoidcontains a value smaller than2. For maximum flexibility in recording traces you can set the value to-1. This allows any user to record any kind of trace, even using raw kernel trace points.The connection between the target device and the host may not be fast enough to transfer the data produced by Perf. Try modifying the values of the Stack snapshot size or Sample period settings.
Perf may be buffering the data forever, never sending it. Add
--no-delayor--no-bufferingto the Additional arguments field.Some versions of Perf will not start recording unless given a certain minimum sampling frequency. Try with a Sample period value of 1000.
On some devices, the hardware performance counters are dysfunctional and the Linux kernel may randomly fail to record data after some time. Perf can use different types of events to trigger samples. You can get a list of available event types by running
perf liston the device and then choose the respective event types in the settings. The choice of event type affects the performance and stability of the sampling. Thecpu-clocksoftwareevent is a safe but relatively slow option as it does not use the hardware performance counters, but drives the sampling from software. After the sampling has failed, reboot the device. The kernel may have disabled important parts of the performance counters system.
Output from the helper program that processes the data is displayed in the General Messages output pane.

