Debugging
Testing

-
If you install PVRStudio, the GNU Symbolic Debugger is installed automatically and you should be ready to start debugging after you create a new project. However, you can change the setup to use debugging tools for Windows, for example. You can connect devices to your development host and debug processes running on the devices.
-
PVRStudio integrates Valgrind code analysis tools for detecting memory leaks and profiling function execution. You must download and install them separately to use them from PVRStudio.
Debugging
PVRStudio provides a debugger plugin that acts as an interface between the PVRStudio core and external native debuggers such as the GNU Symbolic Debugger (GDB), the Microsoft Console Debugger (CDB), a JavaScript debugger, and the debugger of the low level virtual machine (LLVM) project, LLDB.
-
The debugger plugin automatically selects a suitable native debugger for each kit from the ones found on your system. You can edit the kits to override this choice.
-
To start an application from an open project under the control of a debugger, select the image:: images/pvrstudio-debug-button.png (Start Debugging of Startup Project) button or press F5. Other, less common start options are available in the Debug > Start Debugging menu.
-
You can use the tool views in the Debug mode to inspect the state of your application while debugging.
-
PVRStudio is able to show complex data types in a customized, user-extensible manner. For this purpose, it takes advantage of two technologies, collectively referred to as debugging helpers.
Debugging a C++ Example Application
Illustrates how to debug C++ applications in PVRStudio.
-
If you encounter problems while debugging, check for possible solutions to them.
Setting Up Debugger
The main debugger settings are associated with the kit you build and run your project with. To specify the debugger and compiler to use for each kit, select Tools > Options > Kits.
You need to set up the debugger only if the automatic setup fails, because the native debugger is missing (as is usually the case for the CDB debugger on Windows, which you always must install yourself) or because the installed version is not supported (for example, when your system contains no, or an outdated version of GDB and you want to use a locally installed replacement instead).
Note: If you need to change the debugger to use for an automatically detected kit, you can Clone the kit and change the parameters in the clone. Make sure to select the cloned kit for your project.
If the debugger you want to use is not automatically detected, select Tools > Options > Kits > Debuggers > Add to add it.
Note: To use the debugging tools for Windows, you must install them and add the Symbol Server provided by Microsoft to the symbol search path of the debugger. For more information, see Setting CDB Paths on Windows.
Note: To use the Free Software Foundation (FSF) version of GDB on macOS, you must sign it and modify your kit settings.
This section explains the options you have for debugging C++ code and provides installation notes for the supported native debuggers. It also applies for code in other compiled languages such as C, FORTRAN, Ada.
For more information on the debugger modes, see Launching the Debugger in Different Modes.
Supported Native Debugger Versions
PVRStudio supports native debuggers when working with compiled code. On most supported platforms, the GNU Symbolic Debugger GDB can be used. On Microsoft Windows, when using the Microsoft tool chain, the Microsoft Console Debugger CDB is needed. On macOS and Linux, the LLDB debugger can be used.
The following table summarizes the support for debugging C++ code:
Platform |
Compiler |
Native Debugger |
|---|---|---|
Linux |
GCC, ICC |
GDB, LLDB |
Unix |
GCC, ICC |
GDB |
macOS |
GCC, Clang |
LLDB, FSF GDB (experimental) |
Windows/MinGW |
GCC |
GDB |
Windows/MSVC |
Microsoft Visual C++ Compiler |
Debugging Tools for Windows/CDB |
Supported GDB Versions
Starting with version 3.1, PVRStudio requires the Python scripting extension. GDB builds without Python scripting are not supported anymore and will not work. The minimum supported version is GDB 7.5 using Python version 2.7, or 3.3, or newer.
For remote debugging using GDB and GDB server, the minimum supported version of GDB server on the target device is 7.0.
Supported LLDB Versions
The LLDB native debugger has similar functionality to the GDB debugger. LLDB is the default debugger in Xcode on macOS for supporting C++ on the desktop. LLDB is typically used with the Clang compiler (even though you can use it with GCC, too).
On macOS you can use the LLDB version delivered with Xcode or build from source. The minimum supported version is LLDB 320.4.
On Linux, the minimum supported version is LLDB 3.8.
Installing Native Debuggers
The following sections provide information about installing native debuggers.
GDB
On Windows, use the Python-enabled GDB version that is bundled with the Qt package or comes with recent versions of MinGW. On most Linux distributions, the GDB builds shipped with the system are sufficient.
You can also build your own GDB, as instructed in Building GDB.
Builds of GDB shipped with Xcode on macOS are no longer supported.
Debugging Tools for Windows
To use the CDB debugger, you must install the Debugging tools for Windows. You can download them from Download and Install Debugging Tools for Windows as part of the Windows SDK.
Note: Visual Studio does not include the Debugging tools needed, and therefore, you must install them separately.
When manually building PVRStudio using the Microsoft Visual C++
Compiler, the build process checks for the required files in
"%ProgramFiles%\Debugging Tools for Windows".
It is highly recommended that you add the Symbol Server provided by Microsoft to the symbol search path of the debugger. The Symbol Server provides you with debugging informaton for the operating system libraries for debugging Windows applications. For more information, see Setting CDB Paths on Windows.
Debugging Tools for macOS
The binary distribution contains both debug and release variants of the libraries. But you have to explicitly tell the runtime linker that you want to use the debug libraries even if your application is compiled as debug, as release is the default library.
For more detailed information about debugging on macOS, see: Mac OS X Debugging Magic.
LLDB
We recommend using the LLDB version that is delivered with the latest Xcode.
Mapping Source Paths
To enable the debugger to step into the code and display the source code when using a copy of the source tree at a location different from the one at which the libraries were built, map the source paths to target paths:
Select Tools > Options > Debugger > General > Add.
In the Source path field, specify the source path in the debug information of the executable as reported by the debugger.
In the Target path field, specify the actual location of the source tree on the local machine.
Setting CDB Paths on Windows
To obtain debugging information for the operating system libraries for debugging Windows applications, add the Symbol Server provided by Microsoft to the symbol search path of the debugger:
Select Tools > Options > Debugger > CDB Paths.
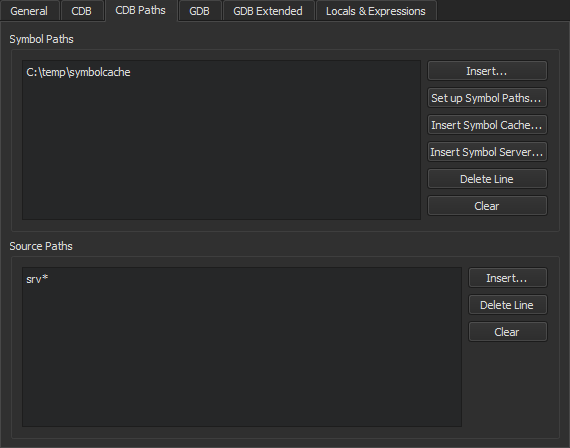
In the Symbol Paths group, select Insert.
Select the directory where you want to store the cached information.
Use a subfolder in a temporary directory, such as
C:\temp\symbolcache.Select OK.
Note: Populating the cache might take a long time on a slow network connection.
To use the Source Server infrastructure for fetching missing source
files directly from version control or the web, enter the following
string in the Source Paths field: srv*.
Setting up FSF GDB for macOS
To use FSF GDB on macOS, you must sign it and add it to the PVRStudio kits.
To create a key for signing FSF GDB, select Keychain Access > Certificate Assistant > Create a Certificate:
In the Name field, input fsfgdb to replace the existing content.
In the Certificate Type field, select Code Signing.
Select the Let me override defaults check box.
Select Continue, and follow the instructions of the wizard (use the default settings), until the Specify a Location For The Certificate dialog opens.
In the Keychain field, select System.
Select Keychain Access > System, and locate the certificate.
Double click the certificate to view certificate information.
In the Trust section, select Always Trust in the When using this certificate field, and then close the dialog.
To sign the binary, enter the following command in the terminal:
codesign -f -s "fsfgdb" $INSTALL_LOCATION/fsfgdb
In PVRStudio, select PVRStudio > Preferences > Kits > Add to create a kit that uses FSF GDB.
In the Debugger field, specify the path to FSF GDB (
$HOME/gdb72/bin/fsfgdb, but with an explicit value for$HOME).To use the debugger, add the kit in the Build Settings of the project.
Launching the Debugger
To start an application from an open project under the control of a debugger, select the image:: images/pvrstudio-debug-button.png (Start Debugging of Startup Project) button or press F5.
PVRStudio checks whether the compiled program is up-to-date, and rebuilds and deploys it if the Always build project before deploying it and Always deploy before running options are selected in the Build and Run options. To debug the program without deploying it, select Debug > Start Debugging > Start Debugging Without Deployment.
The debugger then takes over and starts the program with suitable parameters.
Note: Starting a C++ program in the debugger can take a long time, typically in the range of several seconds to minutes if complex features are used.
Launching the Debugger in Different Modes
The debugger plugin can run the native debuggers in various operating modes depending on where and how the debugged process is started and run. Some of the modes are only available for a particular operating system or platform.
In general, F5 and the Start Debugging of Startup Project button are set up in a way to start the operating mode that is commonly used in a given context. So if the current project is set up as a C++ application using the MinGW toolchain targeting desktop Windows, the GDB engine will be started in Start Internal mode.
Change the run configuration parameters (such as Run in Terminal) in the run settings of the project, or select options from the Debug > Start Debugging menu to select other modes of operation.
The debugger can run in the following modes:
Start Internal to debug applications developed inside PVRStudio.
Start External to start and debug processes without a proper PVRStudio project setup, either locally or on a remote machine.
Attach to debug processes already started and running outside PVRStudio, either locally or on a remote machine.
Core to debug crashed processes on Unix.
Post-mortem to debug crashed processes on Windows.
Launching in Start Internal Mode
Start Internal mode is the default start mode for most projects, including all projects using plain C++ projects.
If you need a console window to operate your application, for example because it accepts console input from the user, go to Projects > Run Settings and select the Run in terminal check box.
To launch the debugger in Start Internal mode, click the Start Debugging button for the active project.
You can specify breakpoints before or after launching the debugger. For more information, see Setting Breakpoints.
Launching in Start External Mode
You can debug any executable already present on your local or on a remote machine without using a project. You specify a build and run kit that identifies the device to debug the application on.
While this mode does not strictly require a project to be opened in PVRStudio, opening it makes setting breakpoints and stepping through the code easier.
To start and debug an external application:
Select Debug > Start Debugging > Start and Debug External Application.
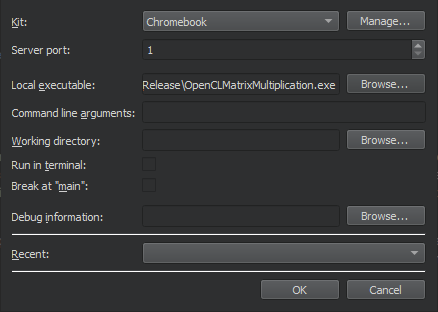
In the Kit field, select the build and run kit to use for building the project.
In the Local executable field, specify the path to the application executable on the local machine.
In the Command line arguments field, specify command line arguments to be passed to the executable.
In the Working directory field, specify the working directory. It defaults to the directory of the build result.
Select the Run in terminal check box for console applications.
Select the Break at “main” check box to stop the debugger at the main function.
In the Debug information field, specify the location for storing debug information. You cannot use an empty path.
In the Recent field, you can select a recent configuration to use.
Launching in Attach Mode
You can attach the debugger to applications that are already running or instruct the debugger to attach to an application when it starts.
Attaching to Running Applications
To attach the debugger to an application already running on your local or on a remote machine:
Select Debug > Start Debugging > Attach to Running Application.
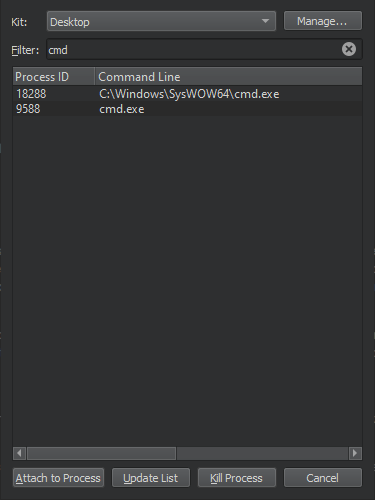
In the Filter field, enter a string to filter processes by their process ID or name.
Select a process in the list, and then select Attach to Process to start debugging.
To refresh the list of running processes, select Update List.
To terminate the selected process, select Kill Process.
While this mode does not strictly require a project to be opened in PVRStudio, opening it makes setting breakpoints and stepping through the code easier.
You can specify breakpoints before or after attaching the debugger to the application. For more information, see Setting Breakpoints.
Attaching to Processes when They Start
To instruct the debugger to watch an application process and to attach to it when it starts:
Select Debug > Start Debugging > Attach to Unstarted Application.
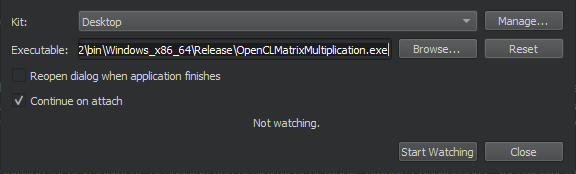
In the Kit field, select the build and run kit to use for building the project.
In the Executable field, specify the path to the application executable.
Select the Reopen dialog when application finishes check box to return to this dialog when the application is closed.
Select the Continue on attach check box to instruct the debugger to keep the application running after attaching to it.
Select Start Watching to wait for the application process to start.
Launching in Core Mode
The Core mode is used to inspect core files (crash dumps) that are generated from crashed processes on Linux and Unix systems if the system is set up to allow this.
To enable the dumping of core files on a Unix system, enter the following command in the shell from which the application will be launched:
ulimit -c unlimited
To launch the debugger in the core mode:
Select Debug > Start Debugging > Load Core File.
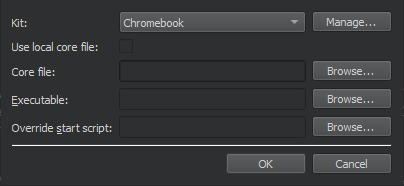
In the Kit field, select a build and run kit that was used for building the binary for which the core file was created. If the core file stems from a binary not built by PVRStudio or a process not initiated by PVRStudio, select a kit that matches the setup used as closely as possible, in respect to the specified device, tool chain, debugger, and sysroot.
In the Core file field, specify the core file to inspect.
In the Executable of symbol file field, specify a file that contains debug information corresponding to the core file. Typically, this is the executable file or a
.debugfile if the debug information is stored separately from the executable.In the Override start script field, specify a script file to run instead of the default start script.
Also in this mode, using a properly configured project containing the sources of the crashed program is not strictly necessary, but helpful.
Launching in Post-Mortem Mode
The post-mortem mode is available only on Windows, if you have installed the debugging tools for Windows.
The PVRStudio installation program asks you whether you want to register PVRStudio as a post-mortem debugger. To change the setting, select Tools > Options > Debugger > General > Use PVRStudio for post-mortem debugging.
You can launch the debugger in the post-mortem mode if an application crashes on Windows. Click the Debug in PVRStudio button in the error message that is displayed by the Windows operating system.
Remote Debugging
PVRStudio provides very easy access to remote debugging.
In general, the remote debugging setup consist of a probe running on the remote machine and a counterpart running on the host side. The probe is either integrated into the running process or runs a separate process (e.g. when using GDB server on embedded Linux). The host side typically consists of PVRStudio itself, often with the help of an external process, such as GDB or CDB.
While this setup might look daunting, it is mostly invisible to the user of PVRStudio. To start debugging on a remote target with the necessary helper processes running, select the corresponding kit in Projects > Build & Run, and then select a function to start remote debugging in the Debug > Start Debugging menu.
Special use cases, such as attaching to a running process on the target, might still require manual setup.
Using GDB
When debugging on a target supported by GDB server, a local GDB process talks to a GDB server running on the remote machine that controls the process to be debugged.
The GDB server process is started on the remote machines by passing a port number and the executable:
gdbserver :1234 <executable>
It then typically responds:
Process bin/pvrstudio created; pid = 5159
Listening on port 1234
On the local machine that runs PVRStudio:
Select Debug > Start Debugging > Attach to Running Debug Server.
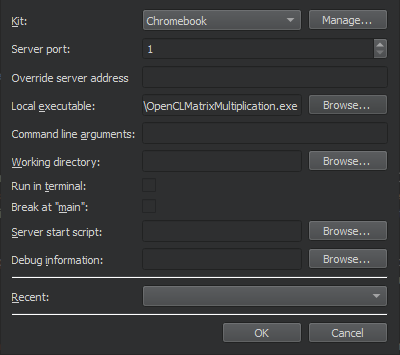
In the Kit field, select the build and run kit to use for building the project.
In the Server port field, enter the name of the remote machine and the port number to use.
In the Local executable field, specify the path to the application executable on the local machine.
In the Command line arguments field, specify command line arguments to be passed to the executable.
In the Working directory field, specify the working directory. It defaults to the directory of the build result.
Select the Run in terminal check box for console applications.
Select the Break at “main” check box to stop the debugger at the main function.
In the Server start script field, specify a script file to run when the server starts.
In the Debug information field, specify the location for storing debug information. You cannot use an empty path.
In the Override server channel field, specify a communication channel to use, such as a serial line or custom port.
In the Recent field, you can select a recent configuration to use.
Select OK to start debugging.
Using CDB
In remote mode, the local CDB process talks to a CDB process that runs on the remote machine. The process is started with special command line options that switch it into server mode. The remote CDB process must load the PVRStudio CDB extension library that is shipped with PVRStudio:
Install the Debugging Tools for Windows on the remote machine. The installation folder contains the CDB command line executable (
cdb.exe).Copy the PVRStudio CDB extension library to the a new folder on the remote machine (32 or 64 bit version depending on the version of the Debugging Tools for Windows used):
\lib\pvrstudiocdbext32\pvrstudiocdbext.dll(32 bit) -\lib\pvrstudiocdbext64\pvrstudiocdbext.dll(64 bit)
Set the _NT_DEBUGGER_EXTENSION_PATH environment variable to point to that folder.
To use TCP/IP as communication protocol, launch remote CDB as follows:
cdb.exe -server tcp:port=1234 <executable>
On the local machine running PVRStudio, select Debug > Start Debugging > Attach to Remote CDB Session.
In the Connection field enter the connection parameters. For example, for TCP/IP:
Server:Port
If you chose some other protocol, specify one of the alternative formats:
tcp:server=Server,port=Port[,password=Password][,ipversion=6]
tcp:clicon=Server,port=Port[,password=Password][,ipversion=6]
npipe:server=Server,pipe=PipeName[,password=Password]
com:port=COMPort,baud=BaudRate,channel=COMChannel[,password=Password]
spipe:proto=Protocol,{certuser=Cert|machuser=Cert},server=Server,pipe=PipeName[,password=Password]
ssl:proto=Protocol,{certuser=Cert|machuser=Cert},server=Server,port=Socket[,password=Password]
ssl:proto=Protocol,{certuser=Cert|machuser=Cert},clicon=Server,port=Socket[,password=Password]
Click OK to start debugging.
Interacting with the Debugger
You can use the PVRStudio Debug mode to inspect the state of your application while debugging. You can interact with the debugger in several ways, including the following:
Go through a program line-by-line or instruction-by-instruction.
Interrupt running programs.
Set breakpoints.
Examine the contents of the call stack.
Examine and modify contents of local and global variables.
Examine and modify registers and memory contents of the debugged program.
Examine the list of loaded shared libraries.
Disassemble sections of code.
PVRStudio displays the raw information provided by the native debuggers in a clear and concise manner with the goal to simplify the debugging process as much as possible without losing the power of the native debuggers.
In addition to the generic IDE functionality provided by stack view, views for locals and expressions, registers, and so on, PVRStudio includes features to make debugging applications easy. The debugger plugin understands most containers of the C++ Standard Library and some GCC extensions. This deeper understanding is used to present objects of such classes in a useful way.
Using the Debugger
In Debug mode, you can use several views to interact with the program you are debugging. The availability of views depends on whether you are debugging C++ or any other language. Frequently used views are shown by default and rarely used ones are hidden. To change the default settings, select Window > Views, and then select views to display or hide. Alternatively, you can enable or disable views from the context menu of the title bar of any visible debugger view.
You can drag and drop the views in PVRStudio to new positions on the screen. The size and position of views are saved for future sessions. Select Window > Views > Reset to Default Layout to reset the views to their original sizes and positions.
To save space on the screen, select Window > Views > Automatically Hide View Titlebars.
Once the program starts running under the control of the debugger, it behaves and performs as usual. You can interrupt a running C++ program by selecting Debug > Interrupt. The program is automatically interrupted when a breakpoint is hit.
Once the program stops, PVRStudio:
Retrieves data representing the call stack at the program’s current position.
Retrieves the contents of local variables.
Examines Expressions.
Updates the Registers, Modules, and Disassembler views if you are debugging the C++ based applications.
You can use the Debug mode views to examine the data in more detail.
You can use the following keyboard shortcuts:
To finish debugging, press Shift+F5.
To execute a line of code as a whole, press F10 (Command+Shift+O on macOS).
To step into a function or a subfunction, press F11 (Command+Shift+I on macOS).
To leave the current function or subfunction, press Shift+F11 (Command+Shift+T on macOS).
To continue running the program, press F5.
To run to the line containing the cursor, press Ctrl+F10 (Shift+F8 on macOS).
To run to the selected function when you are stepping into a nested function, press Ctrl+F6.
It is also possible to continue executing the program until the current function completes or jump to an arbitrary position in the current function.
Setting Breakpoints
A breakpoint represents a position or sets of positions in the code that, when executed, interrupts the program being debugged and passes the control to you. You can then examine the state of the interrupted program, or continue execution either line-by-line or continuously.
PVRStudio shows breakpoints in the Breakpoints view which is enabled by default. The Breakpoints view is also accessible when the debugger and the program being debugged is not running.
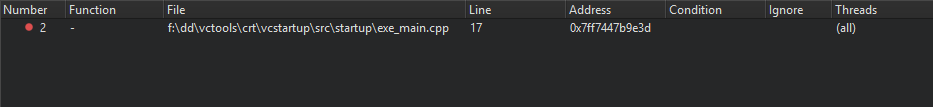
You can associate breakpoints with:
Source code files and lines
Functions
Addresses
Throwing and catching exceptions
Executing and forking processes
Executing some system calls
Changes in a block of memory at a particular address when a program is running
Throwing JavaScript exceptions
The interruption of a program by a breakpoint can be restricted with certain conditions.
You can set and delete breakpoints before the program starts running or while it is running under the debugger’s control. Breakpoints are saved together with a session.
Adding Breakpoints
To add breakpoints:
Add a new breakpoint in one of the following ways:
In the code editor, click the left margin or press F9 (F8 for macOS) at a particular line you want the program to stop.
In the Breakpoints view, double-click in the empty part of the view.
In the Breakpoints view, select Add Breakpoint in the context menu.
In the Breakpoint type field, select the location in the program code where you want the program to stop. The other options to specify depend on the selected location.
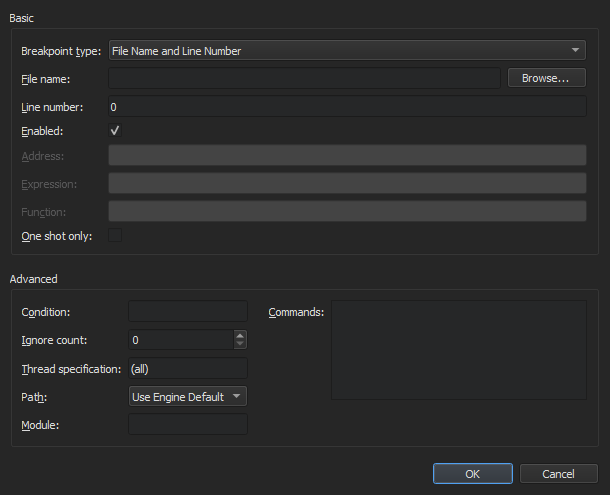
In the Condition field, set the condition to be evaluated before stopping at the breakpoint if the condition evaluates as true.
In the Ignore field, specify the number of times that the breakpoint is ignored before the program stops.
In the Commands field, specify the commands to execute when the program stops; one command on a line. GDB executes the commands in the order in which they are specified.
For more information on breakpoints, see Breakpoints, Watchpoints, and Catchpoints in GDB documentation.
Moving Breakpoints
To move the breakpoint, drag and drop a breakpoint marker to another line.
Deleting Breakpoints
To delete breakpoints:
Click the breakpoint marker in the text editor.
Select the breakpoint in the Breakpoints view and press Delete.
Select Delete Breakpoint in the context menu in the Breakpoints view.
Enabling and Disabling Breakpoints
To temporarily disable a breakpoint without deleting it and losing associated data like conditions and commands:
Right-click the breakpoint marker in the text editor and select Disable Breakpoint.
Select the breakpoint in the Breakpoints view and press Space.
Select Disabled Breakpoint in the context menu in the Breakpoints view.
A disabled breakpoint is marked with a hollow read circle in the text editor and the Breakpoint view.
To re-enable a temporarily disabled breakpoint:
Right-click the marker of a disabled breakpoint in the text editor and select Enable Breakpoint.
Select a disabled breakpoint in the Breakpoints view and press Space.
Select Disabled Breakpoint in the context menu in the Breakpoints view.
With the notable exception of data breakpoints, breakpoints retain their enabled or disabled state when the debugged program is restarted.
Setting Data Breakpoints
A data breakpoint stops the program when data is read or written at the specified address.
To set a data breakpoint at an address:
Right-click in the Breakpoints view to open the context menu, and select Add Breakpoint.
In the Breakpoint type field, select Break on data access at fixed address.
In the Address field, specify the address of the memory block.
Select OK.
If the address is displayed in the Locals or Expressions view, you can select Add Data Breakpoint at Object’s Address in the context menu to set the data breakpoint.
Data breakpoints will be disabled when the debugged program exits, as it is unlikely that the used addresses will stay the same at the next program launch. If you really want a data breakpoint to be active again, re-enable it manually.
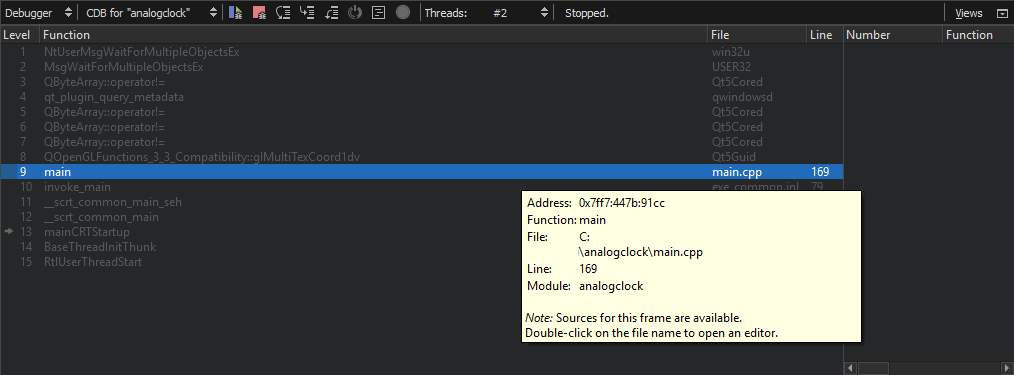
Viewing Call Stack Trace
When the program being debugged is interrupted, PVRStudio displays the nested function calls leading to the current position as a call stack trace. This stack trace is built up from call stack frames, each representing a particular function. For each function, PVRStudio tries to retrieve the file name and line number of the corresponding source file. This data is shown in the Stack view.
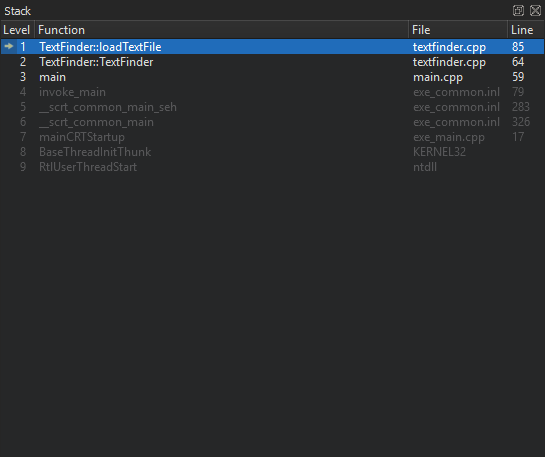
Since the call stack leading to the current position may originate or go through code for which no debug information is available, not all stack frames have corresponding source locations. Stack frames without corresponding source locations are grayed out in the Stack view.
If you click a frame with a known source location, the text editor jumps to the corresponding location and updates the Locals and Expressions views, making it seem like the program was interrupted before entering the function.
Local Variables and Function Parameters
The Locals view consists of the Locals pane and the Return Value pane (hidden when empty).
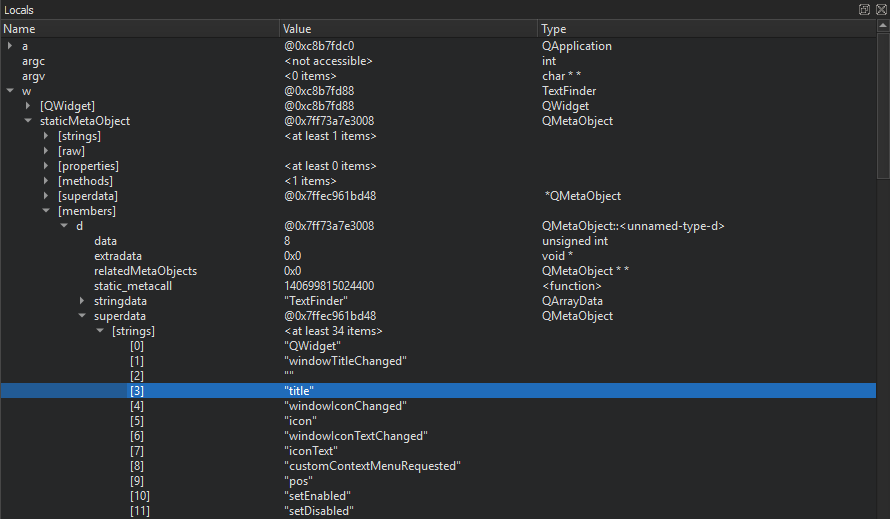
Whenever a program stops under the control of the debugger, it retrieves information about the topmost stack frame and displays it in the Locals view. The Locals pane shows information about parameters of the function in that frame as well as the local variables. If the last operation in the debugger was returning from a function after pressing Shift+F11, the Return Value pane displays the value returned by the function.
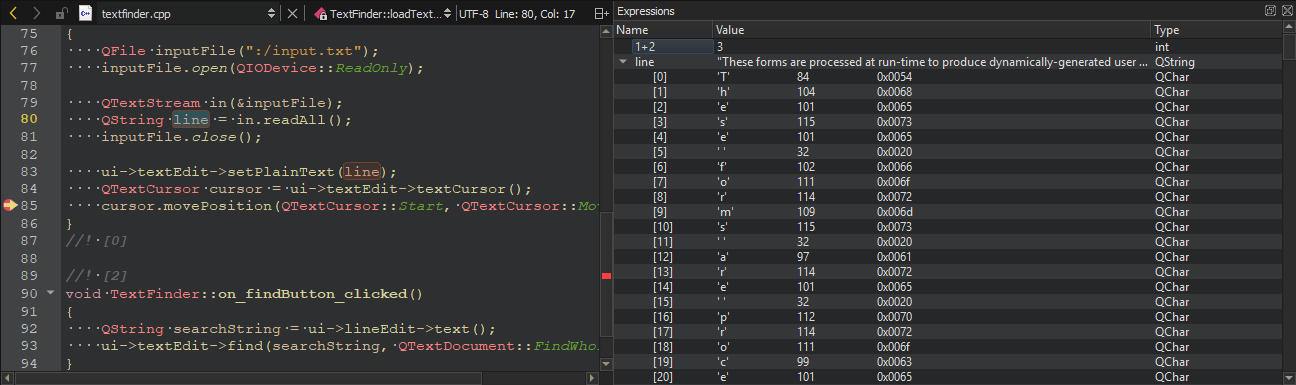
Evaluating Expressions
To compute values of arithmetic expressions or function calls, use expression evaluators in the Expressions view. To insert a new expression evaluator, either double-click on an empty part of the Expressions or Locals view, or select Add New Expression Evaluator from the context menu, or drag and drop an expression from the code editor.
Note: Expression evaluators are powerful, but slow down debugger operation significantly. It is advisable to not use them excessively, and to remove unneeded expression evaluators as soon as possible.
Expression evaluators are re-evaluated whenever the current frame changes. Note that functions used in the expressions are called each time, even if they have side-effects.
GDB, LLDB and CDB support the evaluation of simple C and C++
expressions. Functions can be called only if they are actually
compiled into the debugged executable or a library used by the
executable. Most notably, inlined functions such as most
operator[] implementations of standard containers are typically
not available.
When using GDB or LLDB as backend, a special ranged syntax can be
used to display multiple values with one expression. A sub-expression
of form foo[a..b] is split into a sequence of individually evaluated expressions foo[a], ..., foo[b].
Compound variables of struct or class type are displayed as expandable in the view. Expand entries to show all members. Together with the display of value and type, you can examine and traverse the low-level layout of object data.
Note: |
GDB and LLDB, and therefore PVRStudio’s debugger, also work for optimized builds on Linux and macOS. Optimization can lead to re-ordering of instructions or removal of some local variables, causing the Locals and Expressions view to show unexpected data. |
The debug information provided by GCC does not include enough information about the time when a variable is initialized. Therefore, PVRStudio can not tell whether the contents of a local variable contains “real data”, or “initial noise”. If a QObject appears uninitialized, its value is reported as not in scope. Not all uninitialized objects, however, can be recognized as such. |
Note: The set of evaluated expressions is saved in your session.
Directly Interacting with Native Debuggers
In some cases, it is convenient to directly interact with the command line of the native debugger. In PVRStudio, you can use the left pane of the Debugger Log view for that purpose. When you press Ctrl+Enter, the contents of the line under the text cursor are sent directly to the native debugger. Alternatively, you can use the line edit at the bottom of the view. Output is displayed in the right pane of the Debugger Log view.
Note: Usually, you do not need this feature, because PVRStudio
provides you with better ways to handle the task. For example,
instead of using the GDB print command from the command line, you
can evaluate an expression in the Expressions view.
Debugging C++ Based Applications
The following sections describe additional debugging functions that apply only to debugging C++.
Starting the Debugger from the Command Line
You can use the PVRStudio debugger interface from the command line.
To attach it to a running process, specify the process ID as a
parameter for the -debug option. To examine a core file, specify
the file name. PVRStudio executes all the necessary steps, such as
searching for the binary that belongs to a core file. To connect to a
debug server, specify the server location and port number.
For example:
C:\pvrstudio\bin>pvrstudio -debug 2000-C:\pvrstudio\bin>pvrstudio -debug core=core.2000C:\pvrstudio\bin>pvrstudio -debug some.exe,core=core-C:\pvrstudio\bin>pvrstudio -debug server=some.dot.com:4251
For more information, see Using Command Line Options.
Stepping into Frameworks in macOS
In macOS, external libraries are usually built into so-called Frameworks, which may contain both release and debug versions of the library. When you run applications on the macOS desktop, the release version of Frameworks is used by default. To step into Frameworks, select the Use debug versions of Frameworks option in the project run settings.
Viewing Threads
If a multi-threaded program is interrupted, the Threads view or the combobox named Threads in the debugger status bar can be used to switch from one thread to another. The Stack view adjusts itself accordingly.
Viewing Modules
The Modules view displays information that the debugger plugin
has about modules included in the application that is being debugged.
A module is a dynamic link library (.dll) in Windows, a shared object (.so) in Linux, and a dynamic shared library (.dylib)
in macOS.
In addition, the view displays symbols within the modules and indicates where each module was loaded.
Right-click the view to open a context menu that contains menu items for:
Updating the module list
Loading symbols for modules
Examining modules
Editing module files
Showing symbols in modules
Showing dependencies between modules (Windows only)
By default, the Modules view is hidden.
Viewing Source Files
The Source Files view lists all the source files included in the project. If you cannot step into an instruction, you can check whether the source file is actually part of the project, or whether it was compiled elsewhere. The view shows the path to each file in the file system.
Right-click the view to open a context menu that contains menu items for reloading data and opening files.
By default, the Source Files view is hidden.
Viewing Disassembled Code
The Disassembler view displays disassembled code for the current function.
The Disassembler view is useful for low-level commands for checking single instructions, such as Step Into and Step Over. By default, the Disassembler view is hidden.
To access the Disassembler view, check Debug > Operate by Instruction while the debugger is running. (Operate by Instruction) tool button on the debugger tool bar.
Viewing and Editing Register State
The Registers view displays the current state of the CPU registers. Depending on the CPU type, there will be different registers available. The values of registers that recently have changed are highlighted in red and empty register values as well as leading zeroes are grayed out.
In addition it is possible to edit the content of registers while the program is stopped. This applies to both General-purpose and Special-purpose registers. Registers can be edited in the standard condensed view or in their particular parts if the register is displayed expanded.
By default, the Registers view is hidden.
Using Debugging Helpers
Structured data, such as objects of class, struct, or union types, is displayed in the Locals and Expressions
views as part of a tree. To access sub-structures of the objects,
expand the tree nodes. The sub-structures are presented in their
in-memory order, unless the Sort Members of Classes and Structs
Alphabetically option from the context menu is selected.
Similarly, pointers are displayed as a tree item with a single child item representing the target of the pointer. In case the context menu item Dereference Pointers Automatically is selected, the pointer and the target are combined into a single entry, showing the name and the type of the pointer and the value of the target.
This standard representation is good enough for the examination of
simple structures, but it does usually not give enough insight into
more complex structures, such as QObjects or associative
containers. These items are internally represented by a complex
arrangement of pointers, often highly optimized, with part of the
data not directly accessible through neither sub-structures nor
pointers.
To give the user simple access also to these items, PVRStudio employs Python scripts that are called debugging helpers. Debugging helpers are always automatically used. To force a plain C-like display of structures, select Tools > Options > Debugger > Locals & Expressions, and then deselect the Use Debugging Helper check box. This will still use the Python scripts, but generate more basic output. To force the plain display for a single object or for all objects of a given type, select the corresponding option from the context menu.
PVRStudio ships with debugging helpers for more than 200 of the most popular standard C++ containers, and smart pointers, covering the usual needs of a C++ application developer out-of-the-box.
Extending Debugging Helpers
PVRStudio uses Python scripts to translate raw memory contents and type information data from native debugger backends (GDB, LLDB, and CDB are currently supported) into the form presented to the user in the Locals and Expressions views.
Unlike GDB’s pretty printers and LLDB’s data formatters, PVRStudio’s debugging helpers are independent of the native debugging backend. That is, the same code can be used with GDB on Linux, LLDB on macOS, and CDB on Windows, or any other platform on which at least one of the three supported backends is available.
Adding Custom Debugging Helpers
To add debugging helpers for your own types, no compilation is required, just adding a few lines of Python. The scripts can address multiple versions of your own library, at the same time.
To add debugging helpers for custom types, add debugging helper
implementations to the startup file of the native debuggers (for
example, ~/.gdbinit or ~/.lldbinit) or specify them directly
in the Additional Startup Commands in Tools > Options >
Debugger > GDB.
To get started with implementing debugging helpers for your own data
types, you can put their implementation into the file
share/pvrstudio/debugger/personaltypes.py in your stand-alone
PVRStudio installation. On macOS, the file is bundled into the
PVRStudio application package, where it is located in the
Contents/resources/debugger folder.
To add debugging helpers:
Open the
share/pvrstudio/debugger/personaltypes.pyfile for editing.Add your dumper implementation to the end of the
personaltypes.pyfile. For more information about implementing debugging helpers, see the following sections.To prevent
personaltypes.pyfrom being overwritten when you update your PVRStudio installation, copy it to a safe location outside the PVRStudio installation in your file system and specify the location in Tools > Options > Debugger > Locals & Expressions > Extra Debugging Helpers.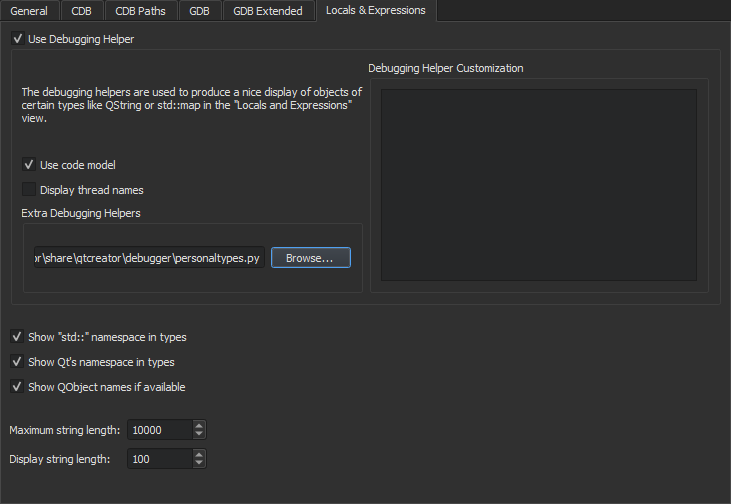
The custom debugging helpers will be automatically picked up from
personaltypes.py when you start a debugging session in PVRStudio
or select Reload Debugging Helpers from the context menu of the
Debugger Log view.
Debugging Helper Overview
The implementation of a debugging helper typically consists of a
single Python function, which needs to be named qdump__NS__Foo, where NS::Foo is the class or class template to be examined. Note
that the :: scope resolution operator is replaced by double underscores: __. Nested namespaces are possible. Template
arguments are not used for the construction of the function name.
Examples:
The name for the function implementing a debugging helper for the type
namespace Project { template<typename T> struct Foo {... } }isqdump__Project__Foo.The name for the function implementing a debugging helper for the type
std::__1::vector<T>::iteratorisqdump__std____1__vector__iterator.
PVRStudio’s debugger plugin calls this function whenever you want to display an object of this type. The function is passed the following parameters:
dof typeDumper, an object containing the current settings and providing facilities to build up an object representing a part of the Locals and Expressions views.valueof typeValue, wrapping either a gdb.Value or an lldb.SBValue.
The qdump__* function has to feed the Dumper object with certain
information that is used to build up the object and its children’s
display in the Locals and Expressions views.
Example:
def qdump__QFiniteStack(d, value):
    alloc = value["_alloc"].integer()
    size = value["_size"].integer()
    d.putItemCount(size)
    if d.isExpanded():
        d.putArrayData(value["_array"], size, value.type[0])
Note: To create dumper functions usable with both LLDB and GDB
backends, avoid direct access to the gdb.* and lldb.* namespaces and use the functions of the Dumper class instead.
To get to the base instance of the object in the debugging helper,
use the value.base() function or the following example code:
def qdump__A(d, value):
   t = value.members(True)[0].type
   dptr, base_v = value.split('p{%s}' % t.name)
   d.putItem(base_v)
Debugging helpers can be set up to be called whenever a type name
matches a regular expression. To do so, the debugging helper’s
function name must begin with qdump__ (with two underscore
characters). In addition, the function needs to have a third
parameter called regex with a default value that specifies the
regular expression that the type name should match.
For example, the Nim 0.12 compiler assigns artificial names, such as
TY1 and TY2, to all generic sequences it compiles. To
visualize these in PVRStudio, the following debugging helper may be
used:
def qdump__NimGenericSequence__(d, value, regex = "^TY.*$"):
    size = value["Sup"]["len"]
    base = value["data"].dereference()
    typeobj = base.dereference().type
    d.putArrayData(base, size, typeobj)
Debugging Helper Implementation
A debugging helper creates a description of the displayed data item in a format that is similar to GDB/MI and JSON.
For each line in the Locals and Expressions views, a string like the following needs to be created and channeled to the debugger plugin.
{ iname='some internal name',           # optional
  address='object address in memory',   # optional
  name='contents of the name column',   # optional
  value='contents of the value column',
  type='contents of the type column',
  numchild='number of children',        # zero/nonzero is sufficient
  children=[              # only needed if item is expanded in view
     {iname='internal name of first child',
       },
     {iname='internal name of second child',
       },

  ]}
The value of the iname field is the internal name of the object,
which consists of a dot-separated list of identifiers, corresponding
to the position of the object’s representation in the view. If it is
not present, it is generated by concatenating the parent object’s
iname, a dot, and a sequential number.
The value of the name field is displayed in the Name column
of the view. If it is not specified, a simple number in brackets is
used instead.
As the format is not guaranteed to be stable, it is strongly
recommended not to generate the wire format directly, but to use the
abstraction layer provided by the Python Dumper classes, specifically
the Dumper class itself, and the Dumper:Value and Dumper:Type abstractions.
These provide a complete framework to take care of the iname and addr fields, to handle children of simple types, references,
pointers, enums, and known and unknown structs, as well as some
convenience functions to handle common situations.
Dumper Class
The Dumper class contains generic bookkeeping, low-level, and
convenience functions.
The member functions of the Dumper class are the following:
putItem(self, value)- The master function that handles basic types, references, pointers, and enums directly, iterates over base classes and class members of compound types, and callsqdump__*functions when appropriate.putIntItem(self, name, value)- Equivalent to:with SubItem(self, name): self.putValue(value) self.putType("int") self.putNumChild(0)putBoolItem(self, name, value)- Equivalent to:with SubItem(self, name): self.putValue(value) self.putType("bool") self.putNumChild(0)putCallItem(self, name, value, func, *args)- Uses the native debugger backend to place the function callfuncon the value specified by value and output the resulting item.Native calls are extremely powerful and can leverage existing debugging or logging facilities in the debugged process, for example. However, they should only be used in a controlled environment, and only if there is no other way to access the data, for the following reasons:
Direct execution of code is dangerous. It runs native code with the privileges of the debugged process, with the potential to not only corrupt the debugged process, but also to access the disk and network.
Calls cannot be executed when inspecting a core file.
Calls are expensive to set up and execute in the debugger.
putArrayData(self, address, itemCount, type)- Creates the number of children specified byitemCountof the typetypeof an array-like object located ataddress.putSubItem(self, component, value)- Equivalent to:with SubItem(self, component): self.putItem(value)Exceptions raised by nested function calls are caught and all output produced by
putItemis replaced by the output of:except RuntimeError: d.put('value="<invalid>",type="<unknown>",numchild="0",')put(self, value)- A low-level function to directly append to the output string. That is also the fastest way to append output.putField(self, name, value)- Appends aname='value'field.childRange(self)- Returns the range of children specified in the currentChildrenscope.putItemCount(self, count)- Appends the fieldvalue='<%d items>'to the output.putName(self, name)- Appends thename=''field.putType(self, type, priority=0)- Appends the fieldtype='', unless the type coincides with the parent’s default child type orputTypewas already called for the current item with a higher value ofpriority.putBetterType(self, type)- Overrides the last recordedtype.putNumChild(self, numchild)- Announces the existence (numchild> 0) or non-existence of child items for the current value. IfputNumChildis not explicitly called, the existence of child items is implied.putValue(self, value, encoding = None)- Appends the filevalue='', optionally followed by the fieldvalueencoding=''. Thevalueneeds to be convertible to a string entirely consisting of alphanumerical values. Theencodingparameter can be used to specify the encoding in case the real value had to be encoded in some way to meet the alphanumerical-only requirement. The parameterencodingis either a string of the formcodec:itemsize:quotewherecodecis any oflatin1,utf8,utf16,ucs4,int, orfloat.itemsizegives the size of the basic component of the object if it is not implied bycodecandquotespecifies whether or not the value should be surrounded by quotes in the display.Example:
# Safe transport of quirky data. Put quotes around the result.
d.putValue(d.hexencode("ABC\"DEF"), "utf8:1:1")
putStringValue(self, value)- Encodes a QString and callsputValuewith the correctencodingsetting.putByteArrayValue(self, value)- Encodes a QByteArray and callsputValuewith the correctencodingsetting.isExpanded(self)- Checks whether the current item is expanded in the view.createType(self, pattern, size = None)- Creates aDumper.Typeobject. The exact operation depends onpattern.If
patternmatches the name of a well-known type, aDumper.Typeobject describing this type is returned.If
patternis the name of a type known to the native backend, the returned type describes the native type.Otherwise,
patternis used to construct a type description by interpreting a sequence of items describing the field of a structure as follows. Field descriptions consist of one or more characters as follows:q- Signed 8-byte integral value -Q- Unsigned 8-byte integral valuei- Signed 4-byte integral value -I- Unsigned 4-byte integral valueh- Signed 2-byte integral value -H- Unsigned 2-byte integral valueb- Signed 1-byte integral value -B- Unsigned 1-byte integral valued- 8-byte IEEE 754 floating point value -f- 4-byte IEEE 754 floating point valuep- A pointer, that is, an unsigned integral value of suitable size according to the target architecture@- Suitable padding. The size is determined by the preceding and following field and the target architecture<n>s- A blob of <n> bytes, with implied alignment of 1 -<typename>- A blob of suitable size and suitable alignment determined by aDumper.Typewith the nametypename
Dumper.Type Class
The Dumper.Type class describes the type of a piece of data,
typically a C++ class or struct, a pointer to a struct, or a
primitive type, such as an integral or floating point type.
Type objects, that is, instances of the Dumper.Type class, can be
created by native debugger backends, usually by evaluating Debug
Information built into or shipped alongside the debugged binary, or
created on-the-fly by the debugging helper.
The member functions of the Dumper.Type class are the following:
name- The name of this type as a string, orNoneif the type is anonymous.size(self)- Returns the size of an object of this type in bytes.bitsize(self)- Returns the size of an object of this type in bits.(alignment(self)- Returns the required alignment for objects of this type in bytes.deference(self)- Returns the dereferences type for pointer type,Noneotherwise.pointer(self)- Returns a pointer type that can be dereferenced to this type.target(self)- A convenience function that returns the item type for array types and the dereferenced type for pointers and references.stripTypedefs(self)- Returns the underlying type if this typef is an alias.templateArgument(self, position, numeric = False)- Returns the template parameter located atpositionif this is a templated type. IfnumericisTrue, returns the parameter as an integral value.fields(self)- Returns a list ofDumper:Fieldsdescribing the base classes and data members of this type.
Dumper.Field Class
The Dumper.Field class describes a base class or a data member of
a type object.
The member function and properties of the Dumper.Field class are
the following:
isBaseClass- Distinguishes between base classes and data members.fieldType(self)- Returns the type of this base class or data member.parentType(self)- Returns the owning type. -bitsize(self)- Returns the size of this field in bits.bitpos(self)- Returns the offset of this field in the owning type in bits.
Dumper.Value Class
The Dumper.Value class describes a piece of data, such as
instances of C++ classes or primitive data types. It can also be used
to describe artificial items that have no direct representation in
memory, such as file contents, non-contiguous objects, or
collections.
A Dumper.Value has always an associated Dumper.Type. The two
main representations of the value’s actual data are:
Python object following the Python buffer protocol, such as a Python
memoryview, or abytesobject. Thesize()should match the size of this value’s type.An integral value representing a pointer to the begin of the object in the current address space. The size of the object is given by its type’s
size().
Knowledge of the internal representation of a Dumper.Value is
typically not required when creating a debugger helper for it.
The member function and properties of the Dumper.Value class are
the following:
integer(self)- Returns an interpretation of this value as a signed integral value of a suitable size.pointer(self)- Returns an interpretation of this value as a pointer in the current address space.members(self)- Returns a list ofDumper.Valueobjects representing the base objects and data members of this value.dereference(self)- For values describing pointers, returns the dereferenced value, andNoneotherwise.cast(self, type)- Returns a value that has the same data as this value, but the typetype.address(self)- Returns the address of this value if it consists of a contiguous region in the current address space, andNoneotherwise. -data(self)- Returns the data of this value as a Pythonbytesobject. -split(self, pattern)- Returns a list of values created according topatternfrom this value’s data. Acceptable patterns are the same as forDumper.createType.dynamicTypeName(self)- Tries to retrieve the name of the dynamic type of this value if this is a base class object. ReturnsNoneif that is not possible.
Children and SubItem Class
The attempt to create child items might lead to errors if data is
uninitialized or corrupted. To gracefully recover in such situations,
use Children and SubItem Context Managers to create the
nested items.
The Children constructor __init__(self, dumper, numChild = 1, childType = None, childNumChild = None, maxNumChild = None, addrBase = None, addrStep = None)
uses one mandatory argument and several optional arguments. The
mandatory argument refers to the current Dumper object. The optional arguments can be used to specify the number numChild of
children, with type childType_ and childNumChild_ grandchildren each. If maxNumChild is specified, only that many
children are displayed. This should be used when dumping container
contents that might take overly long otherwise. The parameters
addrBase and addrStep can be used to reduce the amount of
data produced by the child dumpers. Address printing for the nth
child item will be suppressed if its address equals with addrBase +
n * addrStep.
Example:
if d.isExpanded():
    with Children(d):
        with SubItem(d):
            d.putName("key")
            d.putItem(key)
        with SubItem(d):
            d.putName("value")
            d.putItem(value)
Note that this can be written more conveniently as:
d.putNumChild(2)
if d.isExpanded():
    with Children(d):
        d.putSubItem("key", key)
        d.putSubItem("value", value)
Debugging a C++ Example Application
This section uses the TextFinder example to illustrate how to debug C++ applications in the Debug mode.
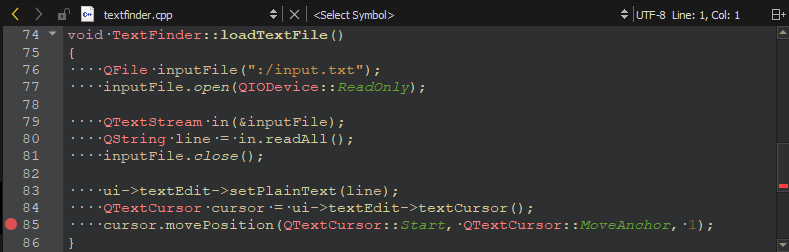
TextFinder reads a text file into QString and then displays it with QTextEdit. To look at the TextFinder class and see the stored data, place a breakpoint in textfinder.cpp, as follows:
Click in between the line number and the window border on the line where we change the cursor position to set a breakpoint.
Select Debug > Start Debugging > Start Debugging of Startup Project or press F5.
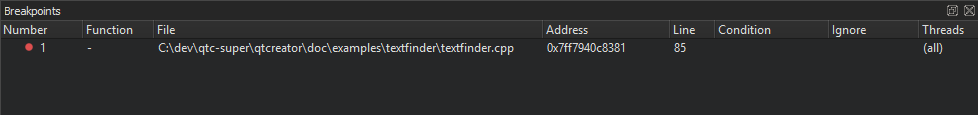
To view information about the breakpoint, go to the Breakpoints view.
To remove a breakpoint, right-click it and select Delete Breakpoint.
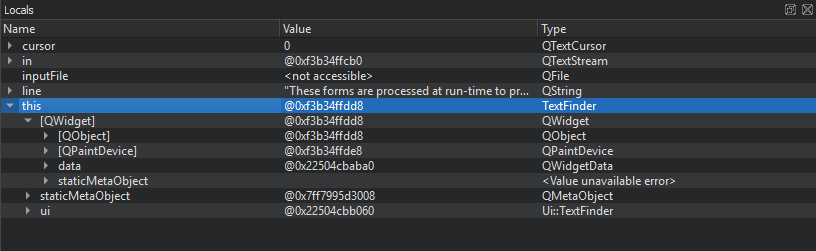
To view the base classes and data members of the TextFinder class, go to the Locals view.
Modify the on_findButton_clicked() function to move back to the
start of the document and continue searching once the cursor hits the
end of the document. Add the following code snippet:
void TextFinder::on_findButton_clicked()
{
    QString searchString = ui->lineEdit->text();

    QTextDocument *document = ui->textEdit->document();
    QTextCursor cursor = ui->textEdit->textCursor();
    cursor = document->find(searchString, cursor,
        QTextDocument::FindWholeWords);
    ui->textEdit->setTextCursor(cursor);

    bool found = cursor.isNull();

    if (!found && previouslyFound) {
        int ret = QMessageBox::question(this, tr("End of Document"),
        tr("I have reached the end of the document. Would you like "
        "me to start searching from the beginning of the document?"),
        QMessageBox::Yes | QMessageBox::No, QMessageBox::Yes);

        if (ret == QMessageBox::Yes) {
            cursor = document->find(searchString,
                QTextDocument::FindWholeWords);
            ui->textEdit->setTextCursor(cursor);
        } else
            return;
    }
    previouslyFound = found;
}
If you compile and run the above code, however, the application does not work correctly due to a logic error. To locate this logic error, step through the code using the following buttons: image:: images/pvrstudio-debug-button-stop.png (Stop Debugger), image:: images/debugger_stepover_small.png (Step Over), image:: images/debugger_stepinto_small.png (Step Into), and image:: images/debugger_stepout_small.png (Step Out).
Troubleshooting Debugger
This section lists some typical problems that you might encounter while debugging and solutions to them.
Cannot Launch Debugger
Some anti-virus applications do not allow debuggers to retrieve data. For example, on Windows, launching the debugger might fail with the following message if the Avira AntiVir is installed on the development PC: The inferior stopped because it received a signal from the operating system. Signal name:? signal meaning: Unknown signal.
Some versions of Avira AntiVir Desktop-Products contain known issues
in various development environments, including PVRStudio. To fix the
problem, Avira instructs you to update to version
avipbb.sys 10.0.22.22. For more information, see Restricted
Usability of IDE/Debuggers since
2010-12-08.
On some devices, such as Wacom Tablets, running processes might stop the debugger from launching. Stop all running processes and then relaunch the debugger.
Debugger Does Not Hit Breakpoints
You might have created a release build that does not contain debug
information. A GNU Compiler Collection (GCC) debug build has the
-g option on the compiler command line. Check that this option is
present in the Compile Output pane. If it is not, adjust your
build settings in the Projects mode.
Debugger Does Not Work
If the debugger does not work properly, try the following:
Make sure you use the latest version of PVRStudio
Make sure the debugger is set up properly. For more information, see Setting Up Debugger.
In the Debug mode, select Window > Views > Debugger Log to open the Debugger Log view. Browse the contents of the pane on the right hand side to find out what went wrong. Always attach or paste the contents of the pane to to the PowerVR forum or support ticket.
Pointer Variable Members Are Not Displayed Directly
When you use the Locals and Expressions views to inspect a pointer variable and expand the variable tree item, another tree item level is displayed. To directly display the members of the pointer variable, select Dereference Pointers Automatically in the context menu in the Locals and Expressions views.
Structure Members Are Not Sorted According to Structure Layout
By default, structure members are displayed in alphabetic order. To inspect the real layout in memory, deselect Sort Members of Classes and Structs Alphabetically in the context menu in the Locals and Expressions views.
Built-in Debugger Is Slow During Startup and Runtime
The part of the slowness that is related to the loading of debug information is hard to avoid. Another part stems from maintaining breakpoints inside the debugger (under some circumstances all breakpoints need to be inserted and removed again for each step) and the evaluation of expressions after each step. We recommend that you minimize the number of breakpoints and watched expressions.
Debugger Cannot Attach to Running Process on Linux
GDB uses ptrace to attach to running processes. Some Linux
distributions do not allow this, which stops all attempts to either
directly attach to an existing process or use the Run in terminal
option in PVRStudio.
The reasons for this are described in KernelHardening.
However, the usefulness of this security measure seems dubious,
because this feature can be easily disabled. With root permissions,
you can disable the feature temporarily by writing 0 into /proc/sys/kernel/yama/ptrace_scope or permanently by changing the
value in /etc/sysctl.d/10-ptrace.conf. Even if you do not have
elevated permissions, you can disable the feature later by adding a
library that calls prctl(0x59616d61, getppid(), 0, 0, 0);, such as the one in $QTCREATORDIR/lib/libptracepreload.so to the
LD_PRELOAD environment.