FAQ
FAQ
This section contains answers to some frequently asked questions about PVRStudio.
General Questions
PVRStudio comes with MinGW, should I use this version instead a different compiler?
It is highly recommneded to use the compiler included in the package for full compatibility.
PVRStudio does not find a helper application, such as Git or a compiler. What should I do?
Make sure that the application is in your system PATH when starting PVRStudio. Also select Tools > Options to check the settings specified for the application. Many plugins specify either the path to the tool they need or the environment they run in.
This is especially relevant for the macOS where /usr/local/bin
might not be in the path when PVRStudio is started.
How do I change the interface language for PVRStudio?
PVRStudio has been localized into several languages. If the system language is one of the supported languages, it is automatically selected. To change the language, select Tools > Options > Environment and select a language in the Language field. The change takes effect after you restart PVRStudio.
What should I do when PVRStudio complains about missing OpenGL support?
Some parts of PVRStudio, use Qt Quick 2, which relies on OpenGL API for drawing. Unfortunately, the use of OpenGL can cause problems, especially in remote setups and with outdated drivers. In these cases, PVRStudio displays OpenGL-related error messages on the console or records them in the Windows debugger log.
The fixes and workarounds differ, depending on your setup. As a last resort, you can disable the affected plugins.
Virtual Machines
Try to enable 3D acceleration in your virtual machine’s settings. For VirtualBox, also make sure you have installed the Guest Addons, including experimental Direct3D support.
Windows
Check whether PVRStudio has been compiled with OpenGL/Desktop, or ANGLE as a backend. The official binaries are always built with ANGLE (a library that maps OpenGL ES API to DirectX).
ANGLE backend: This requires a Windows version newer than Windows XP. If you have problems, try updating your graphics drivers or update your DirectX version. Run
dxdiag.exeto check whether Direct3D Acceleration is indeed enabled.OpenGL backend: Make sure your graphics driver supports OpenGL 2.1 or newer. Try to update your graphics driver.
Unix
Run glxgears for a quick check whether OpenGL works in general. Check the output of glxinfo to get more details like the OpenGL
driver and renderer (search for OpenGL in the application’s
output).
If you are using the Mesa driver, you can force OpenGL to be rendered
in software by setting the LIBGL_ALWAYS_SOFTWARE environment
variable.
Disabling plugins
You can disable the PVRStudio plugins, at the expense of losing functionality:
Disable the plugins permanently by selecting Help > About Plugins.
Debugger Questions
For information on troubleshooting debugger, see Troubleshooting Debugger.
If I have a choice of GDB versions, which should I use?
On Linux and Windows, use the Python-enabled GDB versions that are installed when you install PVRStudio and SDK. On macOS, GDB is no longer officially supported. To build your own Python-enabled GDB, follow the instructions in Building GDB.
You must use Python version 2.6 or 2.7.
For more information on setting up debugger, see Setting Up Debugger.
How do I generate a core file in PVRStudio?
To trigger the GDB command that generates a core file while
debugging, select Window > Views > Debugger Log. In the
Command field, type gcore and press Enter. The core file
is created in the current working directory. You can specify another
location for the file, including a relative or absolute path, as an
argument of the command.
Compiler Questions
How can I make use of my multi-core CPU with PVRStudio?
On Linux and macOS, go to Project mode, select your configuration
in the Build Settings, locate the Build Steps, and add the
following value, where <num> is the amount of cores in your CPU: -j <num>
On Windows, nmake does not support the -j parameter. Instead, we
provide a drop-in replacement called jom. You can download a
precompiled version of jom from Qt Downloads. Put
jom.exe in a location in the %PATH%. Go to the Build Settings and
set jom.exe as the make command.
Note: Unlike GNU make, jom automatically detects your cores and
spawns as many parallel processes as your CPU has cores. You can
override this behavior by using the -j parameter as described
above.
Installation Questions
Which development packages from the distribution are needed on Ubuntu or Debian?
sudo apt-get install libglib2.0-dev libSM-dev libxrender-dev libfontconfig1-dev libxext-dev
If you use OpenGL, you also need:
sudo apt-get install libgl-dev libglu-dev
Where is application output shown in PVRStudio?
On Unix (Linux and macOS): qDebug() and related functions use
the standard output and error output. When you run or debug the
application, you can view the output in the Application Output
pane.
For console applications that require input, select Projects > Run Settings > Run in terminal. To specify the terminal to use, select Tools > Options > Environment > System.
On Windows: Output is displayed differently for console applications and GUI applications.
When you run a console application, you can view the output in the
console window of the calling application. If the calling application
is a GUI application (for example, a release-built version of
PVRStudio), a new console window is opened. For this type of
application, qDebug() and related functions use standard output
and error output.
We recommend that you select Projects > Run Settings > Run in terminal for console applications.
For GUI applications, qDebug() and related functions use the Windows API function OutputDebugString(). The output is displayed
in the Application Output pane. However, only one output pane tab
may be open at a time or the output is not displayed correctly. You
can use an external debug output viewer, such as the DebugView for Windows
to display output from GUI applications.
Questions about New Features
Why does PVRStudio not use tabs for editors?
This question comes up from time to time, so we have considered it carefully. Here are our main reasons for not using tabs:
Tabs do not scale. They work fine if you have 5 to 6 editors open, they become cumbersome with 10, and if you need more horizontal space than the tab bar, the interface does not work at all.
Tabs do not adapt to your working set.
The common solution is to give the user the ability to reorder tabs. Now user has to manage tabs instead of writing code.
Tabs force you to limit the amount of open editors, because otherwise you get confused.
Consider the following use case: Developers want to switch editors.
In fact, developers do not want to switch editors, but might have to do so to accomplish their tasks. We need to figure out what the tasks are to provide developers with better ways to navigate while performing the tasks.
One common factor in many use cases is switching editors while working on a set of open files. While working on files A and B, users sometimes need to look at file C. They can press Ctrl+Tab to move between the files and have the files open in the correct editor according to file type. The list is sorted by last used.
Typically, users also work on multiple classes or functions that are related, even though they are defined or declared in different files. PVRStudio provides two shortcuts for that: F2 to follow the symbol under cursor and Ctrl+Shift+U to find references to it.
In addition, developers can:
Press F4 to switch between header and source.
Press Alt+Left to move backwards in the navigation history.
Use the locator (Ctrl+K) to simply tell PVRStudio where to go.
The locator can be used to open files, but opening files is also just a step on the way to accomplish a task. For example, consider the following use case: Fix AFunction in SomeClass which comes from someclass.cpp/someclass.h.
With a tabbed user interface, developers would search for
someclass.cpp in the tab bar, and then search for ::AFunction,
only to find out that the function is not located in that file. They
would then search for someclass.h in the tab bar, find our that the
function is inline, fix the problem, and forget where they came from.
With PVRStudio, developers can type Ctrl+K m AFun to find the
function. Typically, they only need to type 3 to 4 characters of the
function name. They can then fix the problem and press Alt+Back
to go back to where they were.
Other locator filters include c for classes, : for all symbols, and (thanks to a community contribution) . for symbols
in the current file.
Tips and Tricks
Moving Between Open Files
To quickly move between currently open files, press Ctrl+Tab.
To move forward in the location history, press Alt+Right (Cmd+Opt+Right on macOS). To move backward, press Alt+Left (Cmd+Opt+Left on macOS). For example, if you use the Locator to jump to a symbol in the same file, you can jump back to your original location in that file by pressing Alt+Left.
Moving To the Edit Mode
To move to the Edit mode and currently active file, press Esc.
If you already are in the Edit mode:
The first press moves focus to the editor
The second press closes secondary windows
Using the Filter in Options Dialog
To find specific settings you require in Tools > Options use the filter located at the top left of the Options dialog box.
Opening Output Panes
The output panes provide a list of errors and warnings encountered during a build, detailed output from the compiler, status of a program when it is executed and debug output, as well as search results.
To open output panes, use the following shortcuts:
Issues pane Alt+1 (Cmd+1 on macOS)
Search Results pane Alt+2 (Cmd+2 on macOS)
Application Output pane Alt+3 (Cmd+3 on macOS)
Compile Output pane Alt+4 (Cmd+4 on macOS)
To open the other output panes, such as General Messages and Version Control, select Window > Output Panes. The menu items also display the keyboard shortcuts that you can use.
For more information about output panes, see Viewing Output.
Using Keyboard Shortcuts
PVRStudio provides many useful keyboard shortcuts. You can see the keyboard shortcut for a menu command in the menu or the tooltip for a button.
To customize, import or export keyboard shortcuts, select Tools > Options > Environment > Keyboard.
Running PVRStudio From Command Line
You can launch PVRStudio from command line using the name of an existing session or a project file by giving the name as the command argument.
For example, running qtcreator somesession, launches PVRStudio
and loads session somesession.
For more information, see Using Command Line Options.
Moving To Symbols
To move straight to a symbol used in a project, select the symbol in the Editor toolbar drop-down menu. For more information on the editor toolbar, see Using the Editor Toolbar.
To jump to a symbol in the current file, press Ctrl+K to open the Locator, enter a period (.), and start typing the symbol name. Then select the symbol in the list. For more information on using the locator, see Searching with the Locator.
Press Ctrl (Cmd on macOS) and click a symbol to move directly to the definition or the declaration of the symbol. You can also move the cursor on the symbol and press F2. For more information, see Moving to Symbol Definition or Declaration.
Displaying Low Level Data
If special debugging of objects fails due to data corruption within the debugged objects, you can switch off the debugging helpers. When debugging helpers are switched off low-level structures become visible.
To switch off the debugging helpers:
Select Tools > Options > Debugger > Locals.
Uncheck the Use Debugging Helper checkbox.
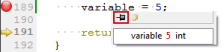
Showing Tooltips in Debug Mode
To inspect the value of variables from the editor, you can turn on tooltips. Tooltips are hidden by default for performance reasons.
Select Tools > Options > Debugger > General.
Select the Use tooltips in main editor while debugging check box.
When you hover over a variable in the code editor in Debug mode, a tooltip is displayed. To keep the tooltip visible, click the pin button. You can expand pinned tooltips to view their full content.
Pinned tooltips are stored in the session. To close all pinned tooltips, select Close Editor Tooltips in the context menu in the Locals view.
Locating Files
The Locator provides one of the easiest ways in PVRStudio to browse through projects, files, classes, functions, documentation and file systems. To quickly access files not directly mentioned in your project, you can create your own locator filters. That way you can locate files in a directory structure you have defined.
To create locator filters, select Tools > Options > Locator > Add.
For more information, see Creating Locator Filters.
Adding a License Header Template for C++ Code
A file containing a license header for C++ can be specified under
Tools > Options > C++ > License Template. It may contain special
placeholders enclosed in %% that are replaced when generating a
new file:
1. %YEAR%: Year 2. %MONTH%: Month
3. %DAY%: Day of the month 4. %DATE%: Date
5. %USER%: Username 6. %FILENAME%: File name
7. %CLASS%: Class name (if applicable) 8. %$VARIABLE%: Contents of environment variable VARIABLE.
Pasting from Clipboard History
PVRStudio stores copied text in clipboard history. To retrieve clips from the history, press Ctrl+Shift+V until the clip appears. The number of clips in the history is fixed to 10.
Sorting Lines Alphabetically
To sort selected lines alphabetically, select Edit > Advanced > Sort Selected Lines or press Alt+Shift+S (or Ctrl+Shift+S on macOS).